StockEagle Studies ![]()
![]()
StockEagle is designed to process and scan more than 100 ticks
each second in realtime against
40+ different studies to ensure that any opportunity is detected and displayed instantly
to you.
StockEagle is flying high above the entire market and from this vantage point instantly
spotting new prey.
You can of cause define a subselection if you dont want to watch the entire market (see the Filter function)
Normalization
One of StockEagle’s powerfull and unique feature is that many studies use a
"normalized" approach.
This means the current market parameters of each stock is compare to its regular context.
Example:
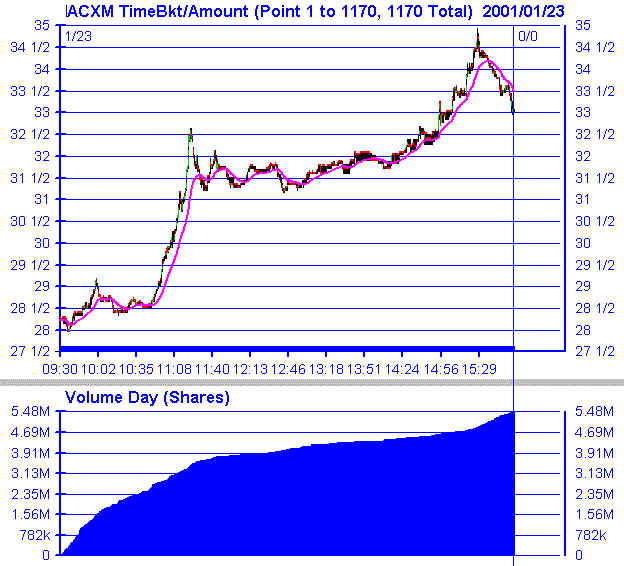
Today (1/23/2001) at 10:41 the volume if ACXM has already reached 2.5Mill shares!
This equals to 29%(Study#1) of its all time volume high (of 8.49Mill a few months ago) or
250%(Study#3) of its 20day volume average of 700,00 shares per day.
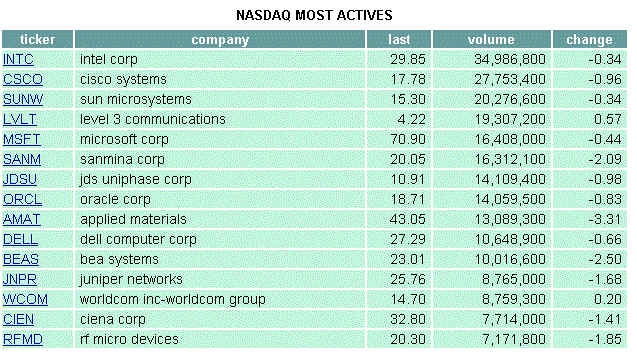
This fairly small volume would never show up in one of those usual non-normalized top
volume stocks lists;
which usually contains the same old stock symbols as shown below (INTC, SUNW, CSCO):
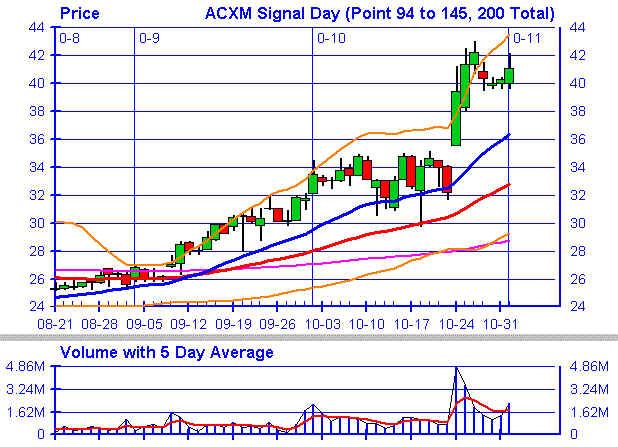
But this very significant volume if 2.5M (within the context of ACXM) brought the price up
from a base of
28.50 at 10:41 to 34.50 by 15:30 (or 40.8% profit margin) or even 42 the next days (47%
profit margin).
This is just one example how StockEagle can help you detect those opportunities AND
RIDE WITH THEM!
(See intraday and daily graph below)
StockEagle Studies
Each study shows maintains its own "hitlist" with the top 17 symbols sorted by
their normalized percentage values.
Some studies need a current stock database (marked with *DB*) while
many others dont.
The following StockEagle studies are available:
Main Page showing study 1 thru 21
Study#1: Volume/All time High (*DB*)
Study#2: Volume/200 Day Avg (*DB*)
Study#3: Volume/50 Day Avg (*DB*)
Study#4: Volume/20 Day Avg (*DB*)
Study#5: New Price High/All time High (*DB*)
Study#6: New Price High/200 Day Avg (*DB*)
Study#7: New Price High/50 Day Avg (*DB*)
Study#8: New Price High/20 Day Avg (*DB*)
Study#9: Day High/% Jump up
Study#10: Day Low/% Jump down
Study#11: Change since last Close/Gap Up (*DB*)
Study#12: Change since last Close/Gap Down (*DB*)
Study#13: Change since todays Open/% Up
Study#14: Change since todays Open/% Down
Study#15: Last Price Jump/% Up (Spread)
Study#16: Last Price Jump/% Down (Spread)
Study#17: Breakouts/% Up
Study#18: Breakouts/% Down
Study#19: Weighted Money Flow/In
Study#20: Weighted Money Flow/Out
Study#21: Rank/Overall summary (*DB*)
2nd Page showing study 22 to 42.
Study#22: Trades Normalized/Full Day
Study#23: Trades Normalized/1 Minute
Study#24: Trades Normalized/10 Minutes
Study#25: Trades Normalized/60 Minutes
Study#26: New High Breaks/All time High (*DB*)
Study#27: New High Breaks/5 Day High (*DB*)
Study#28: New High Breaks/10 Day High (*DB*)
Study#29: New High Breaks/20 Day High (*DB*)
Study#30: Special/52 Week (*DB*)
Study#31: Special/Short BB (*DB*)
Study#32: Day Spread(Percent%)
Study#33: Day Spread(Amount$)
Study#34: Locked Markets
Study#35: Crossed Markets
Study#36: Crossed+Locked Markets
Study#37: Volume Spikes
Study#38: WindUp
Study#39: WindDown
Study#40: RangeUp
Study#41: RangeDown
Study#42: Volume/Absolute
3rd Page showing study 43 and up
Study#43: Below 200 Day Avg
Study#44: Below 50 Day Avg
Study#45: Below 20 Day Avg
To see more details just right-click on the symbol (see Show
Event Detail) or
to reset one single study see Reset one single Column.
IntraDay Graph for the ACXM Example
Daily Graph for the ACXM Example