StockEagle Show Event Detail ![]()
![]()
This function allows you to view the exact details of each entry in all the studies.
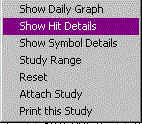
To view the hit details simply click on the symbol in the study you want to get
more information for and select "Show Details" from the small popup menu:
Here is an example screen:
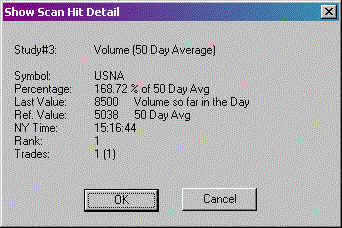
You see the following rows:
1. Long study title: Study#3 Volume (50 Day Average)
2. Symbol (USNA)
3. Exact percentage (168.72%) with parameter it applies to (of 50 Day Average)
4. Last actual Value on which this entry is based (8500 Volume so far in the Day)
5. Reference Value it compares to (5038 50 DayVolume Avg)
6. Excact Time in New York this occured (15:16:44)
7. Rank in the study (1=first)
8. Trades: 1 (1) Estimated trades for the day (so far)
In other words USDA reached almost double the current 50 day volume average at 15:16.
StockEagle also display a brief version of this information on the status window on the
top left already when you just click on the symbol in any study.