
StockEagle Startup
- First start your RealTick
application to get the connection to the stock market
- Then start StockEagle: Start/Programs/StockEagle/StockEagle from the
windows menu
- If you see the initial welcome screen, click OK after reading the
notes to continue
- Wait a few seconds while StockEagle is “Establishing the
connection” and then "Preparing the Portfolio View"
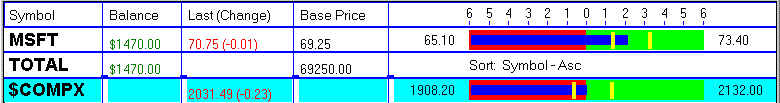
- StocKEagle has initially generate two initial positions:
MSFT = with a 2% gain and 1000 shares
$COMPX = NASDAQ Composite Index with the current value as the entry/reference
- Notice how both positions update themselves in realtime and the
balance changes
Editing a Stock Position
- Notice the yellow bars in the MSFT position indicating the current
day high
- Click anywhere on the MSFT position line and the "Position
Management" window will appear.
Change the number of shares in this position from 100 to 500:
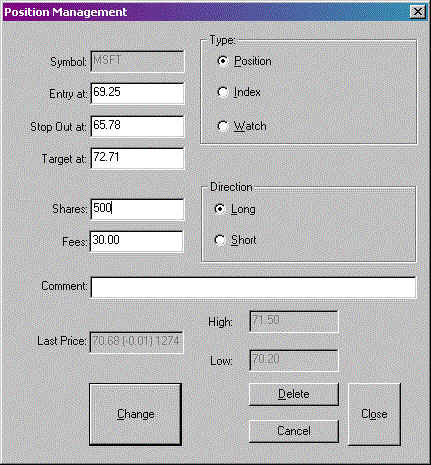
in this example the day high is at 71.50 and the day low at 70.20
- Click on the CHANGE button and StockEagle will show you the new
portfolio
with the updated balance, based on only 500 shares now.
Adding a new Stock Position
- We will now add a sample stock position:
click on the ":Add Position" button and the "Position Management"
window will appear.
- We will assume you bought 1000 shares of YHOO at $15, the stop out is
$12 and the target is $30:

- The click on "Add" button and StockEagle will reload the
Portfolio then show both positions (MSFT and YHOO),
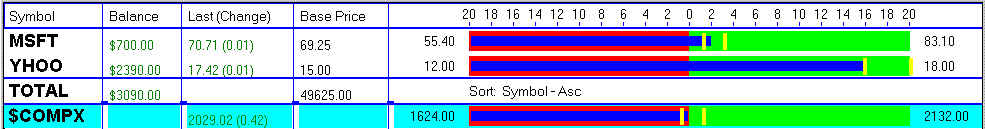
Example:
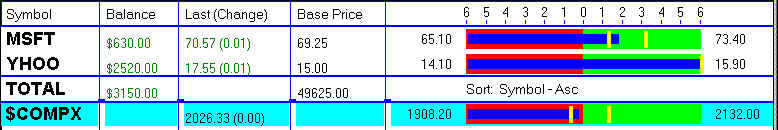
You can see the gain for MSFT is at the 2% mark (blue "thermometer" ends under
the 2% mark),
the YHOO position had gained more than the 6% range (blue "thermometer and at the 6%
limit)
- Will will no expand the percent range -
right click anywhere and select "Percent Range" from the pop up menu:
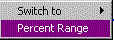 and enter the new range of 20%
  and click CHANGE
- The new display now shows YHOO's gain at 16%:
- To modify a position, just click anywhere on the position line and
edit the parameters in the edit window...
- To delete these sample position, just click anywhere and click on the
Delete or Close button
Starting the Scanning
- In this chapter we will show you how to run the StockEagle
scanner and specify your stock filter
- To start the scanner window click on the “Basic
View” button and wait until the “Basic Scan View”
window appeared
- The first time you open the scan view, StockEagle will quickly load
the daily prices (Open/High/Low etc)
of all stocks and might not be responding for a little while, wait until the Day Start
process is finished
- Most traders only focus on certain market segments and price ranges
StockEagle allows you to use a filter, so that only the stocks that you would consider are
scanned
- Click on "Filter" button in the top row and enter (as an
example) the following parameters:
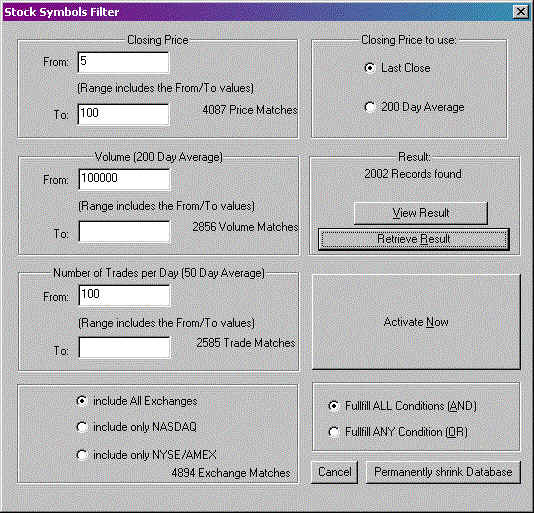
and click on the "Retrieve Result" button
In this example we specified:
a) Price Range from $5 to $100 (using the last closing price instead of the long term 200
day average)
(4087 stock symbols have been found in that price range)
b) A minimum Volume of 100,000 shares (2856 stock symbols have been found with this
volume)
c) A minimum of 100 trades on average per day (2585 stock symbols have been found with
that trade average)
d) use both exchanges (NASDAQ and NYSE/AMEX) (4894 Stock symbols are in both exchanges)
Above the "Retrieve Result" button StockEagle shows you that 2002 stock
fulfilled ALL the specified conditions!
(If you want to actually see the all the selected stock symbols click on the "View
Result" button)
- Now we will active the scanning for this specific list of stock
symbol by pressing the big "Activate Now" button
- The "Stock Symbol Filter" window will close and StockEagle
will immediately
start activating our custom stock symbol list in increments of 500 stocks
(Step1 1...500, Step2 501... 1000 and so on until the full list is activated)
- (If you are interested ONLY in NASDAQ Stocks, then click on the
"Filter" button again,
check the "include only NASDAQ": button and click again on the "Activate
Now" button)
- Now StockEagle will process all incoming new ticks/trades for our
stock symbol list
(you can see the tick counter just above the "Current Time" box in the lower
right corner!)
- As the market pulsates you will see all the study columns filling
rapidly,
showing you the top 18 candidates in each study
- After the initial minute the speed of the study display will slow
down and the column lists will stabilize...
StockEagle in Action
- Now you have the opportunity to check all the presented symbols for
profitable stock plays - the main purpose of StockEagle!
(See "StockEagle in Action" below)
- To get a fresh start we click on the large "Reset all
Columns" button and confirm Yes
- Anytime after 9:40 (on a new trading day) StockEagle will
automatically load the current prices (Day Open/High/Low etc)
- You can revisit anytime to the Filter function and modify your basic
Filter criteria
.If you just want to see how many stocks you will get click on the “Retrieve
Results” button
- The Portfolio View is displayed simultaneously
with the Scan View
To close the Scan View just click on the “Hide” button (StockEagle will of cause
still continue the stock scanning in the background)
- To reopen the scan view just click on “Basic
View” button again from the portfolio view.
- To switch between StockEagle and the other programs in Windows: press
the Alt key with your thumb and tap on the Tab key
Keep pressing the Tab key until the program you want to switch to is selected, then let go
of the Alt key
- We hope you will find StockEagle helpful with it’s 50 functions and more than 30 studies
Now that RealTick3 and StockEagle is ready and running you can
actually find your plays of the day:
The first thing when the market opens is look for GAP’s down to find stocks which
“hit Granite”see Study#12 Change since last Close/Gap Down
and see StockEagle Strategy#1: Hitting Granite
À Also when the market opens is look for GAP’s up with large
volume and price support to go long:see Study#11 Change since last Close/Gap Up
À After 30 to 60 minutes you can scan for new stocks (IPO’s) to go
long:see StockEagle Strategy#4: IPO Rally
À During the day you can periodically monitor the volume and jump
studies for stocks fitting StockEagle Strategy#2: News Ramp as well as StockEagle
Strategy#3: Coming Home
Once you actually enter a position you close the StockEagle View by pressing the
“Esc” key (or click on “Hide”)
and enter Ctrl+A (or File/Add to List) and enter the number of shares and entry price etc.
To go back to the StockEagle View just click on the large “Open StockEagle”
button on the top.
When you close a position click on the line of the position and click on the
“Close” button
and enter your closing price. StockEagle will calculate your Profit/Loss in $ and % as
well
as the original investment amount committed in this position.
If StockEagle crashes when you start the StockEagle View you might have selected an
invalid font
under “Font/StockEagle Font” - select “MS Sans Serif/Regular/Size8” or
“Arial/Regular/Size8”.If it still crashes go to the Eagle.ini file and enter in
the [Sys] Section:
[Sys]
Font=0
RealTick3 Startup and Setup
We recommend to start StockEagle before the market opens.
À Boot your Computer and connect to the Internet Service Provider
(ISP)Start RealTick 3 and wait until it is completely loaded and active(You can confirm
that is is ready by entering a symbol and pressing ENTER)You might want to
“link” the top left window (with the large SYMBOL display)with the Chart and
MarketMaker window:Click on the right mouse button in the top left window and select
“Links”then select “MarketMakers” and click on OK Save with
“Page/Save” from the Main Menu
À Configure the Intraday period in your Chart Window in the
Executioner:Click on the right mouse button while in the Chart Window and select
“Setup”Select Intraday and “15 Minutes” (or any other value you prefer
1/2/5/10/20/30/60/120)Click on OK
À Configure your Studies in your Chart Window in the Executioner:Click
on the right mouse button while in the Chart Window and select “Setup
Studies”Select “Volume” and click on “>>“Select
“Moving Average” and click on “>>“Select “Moving
Average” and click on “>>“Select “Upper Envelope” and click
on “>>“Select “Lower Envelope” and click on
“>>“Select the first “Moving Average” in the right window and
click on “Parameters...” select Period 20 and Exponential and
click on OK Select the 2nd “Moving Average” in the right window and click on
“Parameters...” select Period 50 and Exponential and click on
OK Select “Upper Envelope” in the right window and click on
“Parameters...” select “Bollinger Band” 2.0 and
click on “MA Parameter” and enter 30 and click on OK Select “Lower
Envelope” in the right window and click on “Parameters...”
select “Bollinger Band” 2.0 and click on “MA
Parameter” and enter 30 and click on OK Click on OKSave with “Page/Save”
from the Main Menu
Step 3 and 4 are only needed once - once you save your configuration you
don’t have to repeat it every day!
(C) Copyright 1998 Burkhard Eichberger, Professional Software Solutions, 1626 N.Wilcox
Suite#252, Los Angeles, California 90028, %date