StockEagle Basic Scan View
![]()
![]()
The Basic Scan View is a smaller, simplified version of the Advanced
Scan View
placed just below the portfolio view, so you can still follow your positions!
In the Basic Scan View you can hand-pick 6 from any of the 40+ studies
with the "Attach Study" function (see below).
| HELP (Open this online help) | Filter (define underlying stock filter) |
| Start/Stop Scan (initiate/stop stock scan) | Show NYSE/AMX+NASDAQ (alternate NYSE/NASDAQ display) |
| 30 Min Cutoff (eliminate 30 min old hits) | Show Ticks (Retrieve and display single ticks for a stock) |
| Exclude Stocks (Eliminate selected stocks) | Symbol Info (Show current parameter for a stock) |
| IPO Scan (Check for new stocks/IPO's) | Configure System (Modify System Configuration Parameter) |
| Hide (Hide view, but still continue the scan) | Switch to Advanced (Close Basic and open Advanced View) |
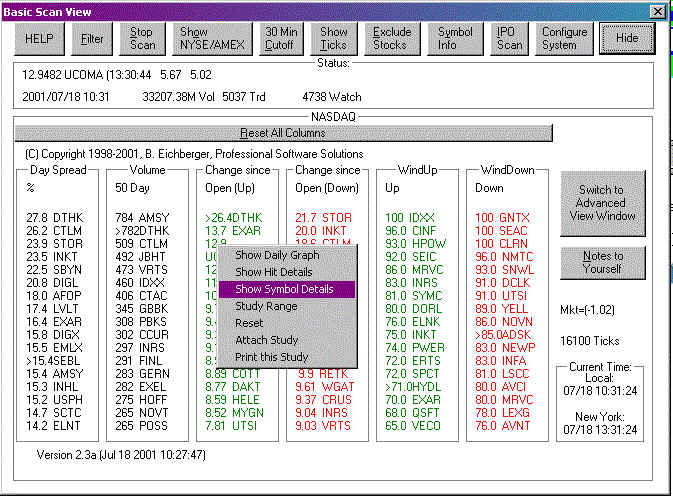
Below is a sample screen of the Basic Scan View:
The six studies selected are:
1. Day Spread % (Stock with large spread between the Day High/Low, DTHK has a 27.8%
Spread)
2. 50 Day Volume (Compares the current volume of the day the 50day average, AMSY has 7.84x
times the Avg )
3. Change since Open Up (Stock with large price increase since the todays open, EXAR is
13.7% up)
4. Change since Open Down (Stock with large price decrease since the todays open, STOR is
21.7% down)
5. WindUp (Stock with are likely to be currently overbought in the near term, IDXX=plus
100%)
6. WindDown (Stock with are likely to be currently oversoldt in the near term, GNTX=minus
100%)
 S
S
How to attach Studies in the Basic View
1. Right click in the colum you want to attach the new study to and a popup menu
appear:
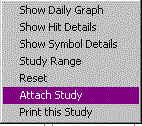
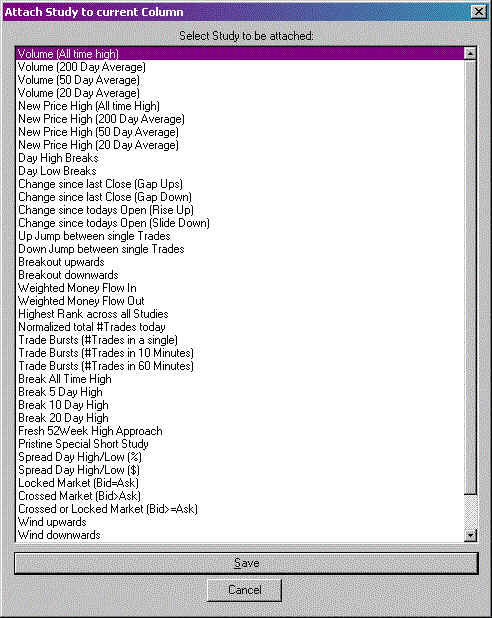
2. Click on the "Attach Study" function
3. Select the Study from the list below and click on the "SAVE" button: