Stock Eagle Portfolio Management
![]()
![]()
The StockEagle Portfolio window shows you all the details of your positions.
StockEagle displays the Portfolio automatically on startup and has retrieved the data from
the server.
You can manage your positions manually,
but StockEagle will also automatically add and close positions if your orders are
executed via the
RealTick III(RT3) Trading System on the same machine were StockEagle is running.
StockEagle will also export all your trades to a standard Quicken file (Eagle.QIF) and
History.txt to
assist you in your trading accounting, using our StockTax
program
(see http://www.ObviousSoft.com)
StockEagle Portfolio Display Styles
1. Percent change from entry price
2. Actual Prices
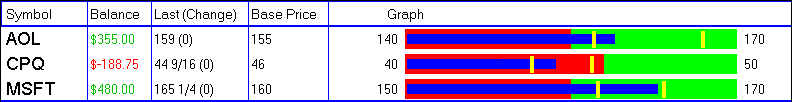
(see Switch between Percent and Price Display)
StockEagle Portfolio Display Layout
The Portfolio View will display the portfolio entrie sin the following order:
Also you can select from the 4 different sort criteria from the "Sort" menu.
You can customize all the 11 different colors in the "Color" menu.
You can customize the fonts from the "Fonts" menu.
All your custom settings are of course saved and restored on re-entry.
You can Add, Edit, Close or Delete your positions at any time.
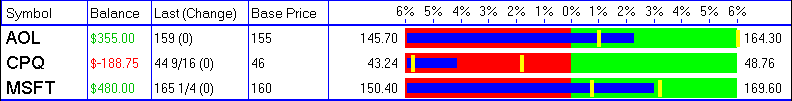
Each "long position" is displayed in one line as shown below:
The blue bar represents the last price, the green area to the right indicates were you
win,
while the red area indicates were you looset.
The small yellow bars indicate the current high and low today.

MSFT = The symbol of your position
$1236.25 = Current profit(or loss) in this moment based on the last price (105 1/16)
105 1/16 (0) = Last price of 105 1/16th, (0) indicated no change yet to the previous last
price
The last price is currently 1/3 between the daily low and high
17159000/15856 = Total volume so far is 17,159,000 shares executed in 15,856 trades
2.4% = Change in percent relative to your entry price
500 = Shares you have bought, here we are 500 long
@102 1/2 = Your entry price, long: buy price, short: sell price
(45.00) = Fee you are estimating to pay for this complete transaction (in and out)
100 = Your stop price: were you plan to close the position in case of a loss
110 = Your target price: were you plan to close the position with a profit
Each "short position" is displayed in one line as shown below:
The blue bar represents the last price, the red area to the green area indicates were you
are winning
while the green area indicates were you make a profit.
The small yellow bars indicate the current high and low today.

CPQ = The symbol of your position
$-145.00 = Current profit(or loss) in this moment based on the last price (27)
27 1/8 (0) = last price of 27 1/8th, (0) indicated no change yet to the previous last
price
The last price is currently in between the daily high and low
21197700/10245 = the total volume so far is 21,197,700 shares executed in 10,245 trades
-0.7% = Change in percent relative to your entry price
-800 = Shares you have sold, here we are 800 short
@27 = Your entry price, long: buy price, short: sell price
(45.00) = The fee are estimating to pay for this complete transaction (in and out)
24 = Your target price: were you plan to close the position with a profit
28 = Your stop price: were you plan to close the position in case of a loss
When StockEagle starts, it will first make the basic connection to the Datafeed,
showing you the message ‘Establishing the Connection ...’ on the bottom.
Then StockEagle will retrieve the data for each position and display the results.
It shows you a graphic representation of the latest price relating to
your buy(sell) price, your stop out and target price and the .high and low of the day.
StockEagle will then automatically update any position with any new trades (just like a
‘Ticker’),
but instead of only the latest price you see also your new profit/loss, changes since last
price,
volume, number of trades, plus the updated graphic representation.
If you start StockEagle for the very first time StockEagle will generate a default set
of positions:
Index: $TICK, $INDU (DowJones), $COMPX, $TRIN
StockEagle will then automatically update any position which makes trades (just like a
[Ticker]),
but instead of only the latest price you see also volume etc. and a graphic representation
and recalculation of the current profit/loss.
Here is a sample screen snapshot of the ‘Portfolio View’:
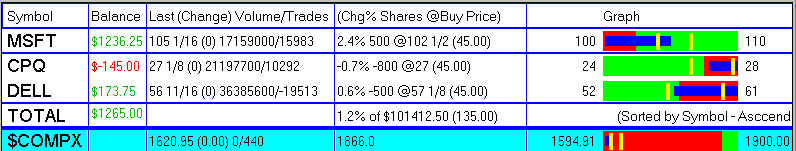
The screen shows:
Explanation of the columns:
| Symbol | Symbol of Stock or Index |
| Balance | Gain(Green) or Loss(red) of each position based on the buy price |
| Balance | Total of all positions in the [TOTAL] row |
| Last Value | Last Value/Price (last change) the color changes to green(up) or red(down) or black (no change yet) |
| Chg% | Change in percent relative to buy price |
| Shares | Number of shares bought |
| @Buy Price | Buy price of longs (Sell price of shorts) |
| Graph/Left | Left edge shows the stop out price |
| Graph/Right | Right edge shows the target price |
| Graph/Blue | The blue line represents the current price within: Stop/Buy/Target |
| Graph/Red | The red area indicates were the position is currently a loss |
| Graph/Green | The green area indicates were the position is currently a gain |
All position details are saved in a separate configuration file \eagle\POS.ini.