Trader Support Add-Ons (TSADD) for Multicharts and TradeStation®
| TradeStation | MultiCharts | Interactive Broker | ThinkOrSwim | AmiBroker | SierraCharts | |
We are one of the Top IB Programming
Consultants:  |
||
We are an approved
TradeStation Easy Language
Specialist: |
||
|
Professional Software Solutions(PSS) Products: The following powerful utilities are available: |
||
Diamond
Backtesting
and Walk Forward Manager (BTWFMgr)
|
||
Universal Trend Detection System
(UNITRDES) "Never miss a trend again" - detects and displays the trend in
any timeframe and market!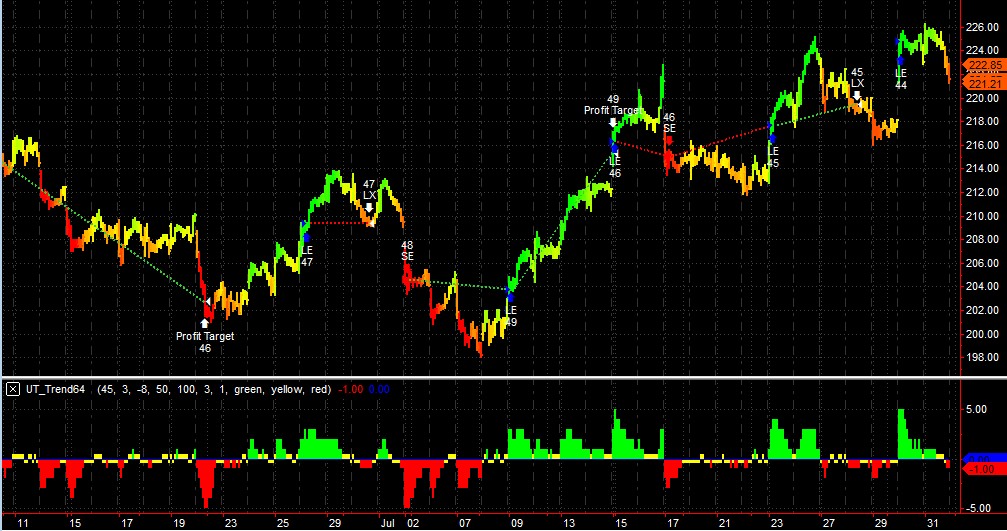 |
||
|
Trading Performance
Analyzer (TrdPerfAna) Details analysis and optimization of your live or back tested TradeStation® Strategy Results Check out the Overview sample here |
||
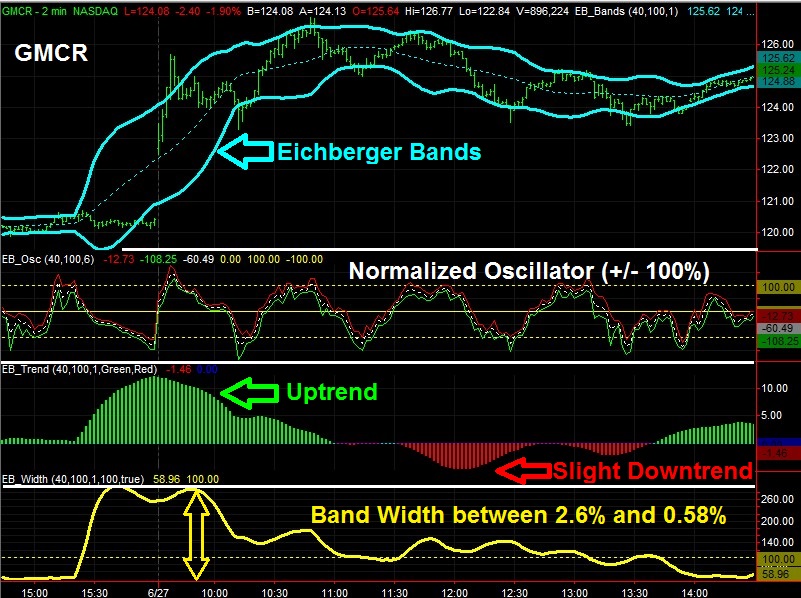
Eichberger Bands
(PssEichB)
Eichberger Bands - the improved Bollinger Bands without the lag and
overshoots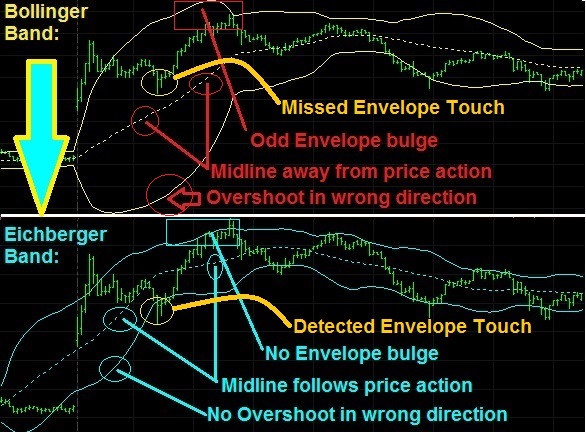
 |
||
| Trading
Simulator (PssTrdSim) Allows you to replay/trade and test your interactive trading skills (any market and timeframe) |
||
| Portfolio Backtesting Sequence Manager
(BTSeqMgr) Save hours by running backtests for your Portfolio - automatically in a customizable series of backtests with BTSeqMgr for any list of symbols(Portfolio) and timeframes (overnight or over a weekend) in TradeStation® |
The following Tools and Indicators are available from Professionel Software Solutions:
|
Professionel Software Solutions Products: The following powerful utilities are available: |
| Trading
Simulator (PssTrdSim) Allows you to replay/trade and test your interactive trading skills (any market and timeframe) |
| Eichberger Bands
(PssEichB) Eichberger Bands - the improved Bollinger Bands without the lag and overshoots |
| Diamond
Backtesting
and Walk Forward Manager (BTWFMgr) State of the art powerful "Swiss army knife" when it comes to optimizing and analyzing your trading strategies -also with walk forward backtesting |
| Universal Trend Detection System
(UNITRDES) "Never miss a trend again" - detects and displays the trend in any timeframe and market! |
|
Trading Performance
Analyzer (TrdPerfAna) Details analysis and optimization of your live or back tested TradeStation® Strategy Results Check out the Overview sample here |
| Portfolio Backtesting Sequence Manager
(BTSeqMgr) Save hours by running backtests for your Portfolio - automatically in a customizable series of backtests with BTSeqMgr for any list of symbols(Portfolio) and timeframes (overnight or over a weekend) in TradeStation® |
|
Bar Countdown
Utility |
|
Internet
Connection Monitor Alerts immediately when you Internet connections drops, so you can avoid very costly missed orders - because your trading strategy did not send your orders |
We also offer any custom programming you might need for Multicharts and TradeStation®
I

"Neither TradeStation Technologies nor any of its affiliates has reviewed, certified, endorsed, approved,
disapproved or recommended, and neither does or will review, certify, endorse, approve, disapprove or
recommend, any product or service that offers training, education or consulting regarding the use of
EasyLanguage®."
_____________________________________________________________________
Buy/Sell Pressure Indicator
This smart Buy/Sell Pressure(BSP) Indicator
can detect trend changes and exhaustion
points much earlier than regular oscillating indicators (RSI, CCI, EMA, MACD
etc).
Here is an example were you can see how we get early trigger signals:
The first significant opposing bar gives the signal (11:27 Short Entry or Sell
Exit)
Try it yourself - 15 days trial period for free:
The Buy/Sell Pressure Indicator offers two approaches:
- Focus on high spikes in on direction (as the example above shows)
- Focus on a continuous sequence of bars in the same direction
and enter when the first bar in the opposite direction occurs
(Example: at 12:45 4 red consecutive bars end)
Note: BSP can only be used for tradable symbols (not indexes)
on X Minute Intraday charts, and daily charts - use 1440 min Intraday
Order Buy/Sell Pressure Indicator here
_____________________________________________________________________
Rapid Response Smooth Average (RareAvg)
TSApp
When following the often erratic Price movements you are always facing a dilemma:
Now after extensive research, we have developed the
"Rapid Response Average Indicator Set" (RareAvg),
which combines the best of both worlds: fast response to changes together with smooth transitions!
In the graph below you can see RareAvg(Yellow) compared with the Exponential(Red) and
Linear(Cyan) Average Indicator.
(You can adjust the RareAvg Indicator - see "Parameters"
below)
The
“Rapid Response Smooth Average (RareAvg)” in the chart above is thick yellow
– compared to the usual “Linear Regression Avg” (cyan) and “Exponential
Mov Avg (red).
As you can see RareAvg combines the best of both worlds: fast response to
changes with smooth transitions!
The 2nd Graph compares the “Rapid Response smooth RSI”
(thick green/yellow/red line) with the “Regular choppy RSI” (thin
green/cyan/red line)..
The 3nd Graph compares the “Rapid Response smooth CCI”
(thick green/yellow/red line) with the “Regular choppy CCI” (thin
cyan line).
As you can see in these examples the RareAvg Indicators offers you excellent
signals, by combining a sophisticated rapid response logic with a smooth/non-choppy
graph..
We have also included the new rapid response smooth RSI, CCI, MACD and
Bollinger Band indicators for you:
Below you can see the new rapid response smooth
MACD indicators:
The
3nd Graph above shows the “Smooth Rapid Response MACD”
(thick green/yellow line) with an earlier cross-over
than the “Regular choppy MACD” (thin green/yellow line) in the 2nd
Graph.
Below you can see the new rapid response smooth
Bollinger Band indicators:
In
the chart above you we present also the smooth “Rapid Response Bollinge
Bands” (white dotted line) and
the “Rapid Response Smooth Average (RareAvg)” in the chart above is thick
yellow – compared to the usual “Linear Regression Avg” (cyan) and
“Exponential Mov Avg (red).
As you can see RareAvg combines the best of both worlds: fast response to
changes with smooth transitions!
Rapid Response Average Parameters:
You can adjust the "Rapid Response Indicators" behavior using the
following input parameters:
| Parameter | Description |
| LengthMain | This is the main parameter -
setting the scope or lookback in bars - to be used in the calculations
(20 Bars = default) (affects mainly the responsiveness) |
| LengthSmooth | Here you can set how smooth the average moves (0=default)
- try 5,10, 15 etc (affects the smoothness around the main line) |
| ResponseFac | Defines how to respond to [sudden] price changes (0=default) - try 150,200, 250 etc |
| bContinuousIntraday | Applies only to Intra-day charts TRUE = Calculate as one continuous line FALSE= Reset the calculation for each new day (to avoid overshoots on strong gap days) |
Order the Rapid Response Smooth Average Indicator here
_____________________________________________________________________
Trend Reversal and Strength
Indicator (TrendRev)
This indicator set helps you detect the strength, direction
and reversal opportunities in short -term trends.
You have the following two indicators available:
In the sample graph below you can see 2 profitable Short entries (Red Arrow) and
3 Long entries (2 break even, 1 profitable)
In
the chart above we present the “Trend Reversal and Strength Indicator
(TrendRev)”.
It uses powerful logic to detect the current trend strength and
trend direction/reversals at an early stage.
The 2nd Indicator (thick white/yellow line) shows the strength and
“age” of the trend.
The 3rd Indicator (thick red/white/green line) shows the current
trend direction and early reversal points
| Price | Price to use - (High+Low+Close)/3 is default) |
| SmoothLen | Defines the Smoothing length (in Bars) in the TrendRev Indicator (20=default) |
| FacFast | Defines the fast response factor - how quick the Trend
responds to Price changes (0=default - which translates to 10. minimum 10 and smaller than FacSlow) |
| FacSlow | Defines the slow response factor - how large the context
scope is (larger = bigger) (0=default - which translates to 120, larger than FacFast) |
| FacStrength | Defines the Strength amplitude adjustment - a factor
expanding or compressing the scale (1=default(original value), 2=double, 0.5=half) |
| StrengthTrigger | Defines the minimum trend strength (above dotted line), then check for pivots |
Order the Trend Reversal+Strength Indicators here
_____________________________________________________________________
Robust Regression System
This powerful "Robust Regression System (RRS))" indicator
is showing you
the direction and strength of trends with all the
noise filtered out.
It uses the sophisticated statistical methods developed by A.F.Siegel and
P.J.Rousseeuw.
You can use the RRS pivots above a minimum (yellow) trigger line for entries,
or the trend green/red cross-overs for reversals.
See the red(short) and green(long) signals in the example below,
In
the chart above we present the “Robust Regression System (RRS)”.
It uses sophisticated noise filter logic to show you
the trend strength and trend reversals at an early stage. Green = Up Trend, Red
= Down Trend
Order the Robust Regression System Indicator here
for more details see:
P.J. Rousseeuw "Robust Regression and Outlier Detection" 1987 and
A.F.Siegel "Robust Regression using repeated Medians" 1982
_____________________________________________________________________
Advanced Normalized Momentum Indicator
This powerful indicator can detect trend reversals early;
See the red(short) and green(long) signals in the example below,
when the trend reverses from an extreme (look for trend Pivots from significant
extremes)
Testimony from a client(XavierM): "I have tried other momentum versions,
but this Momentum indicator is by far the cleanest and reacts quicker than any paid or free version that I have come
accross."
In
the chart above we present the “Advanced Normalized Momentum Indicator” .
It shows trend reversals (crossing the neural yellow line) and trend
strength (excursion into green/red areas)
Order the Advanced Momentum Indicator here
_____________________________________________________________________
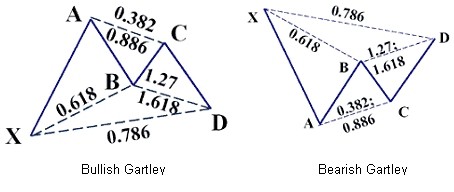
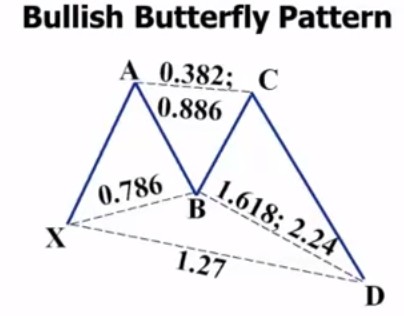
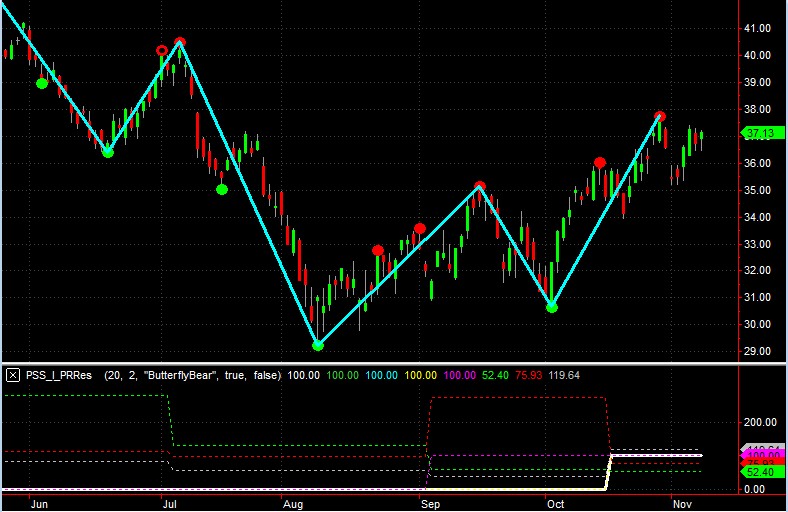
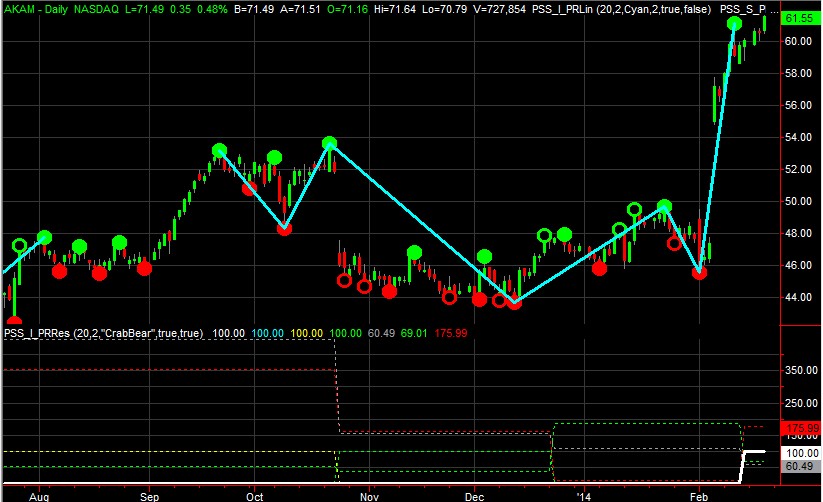
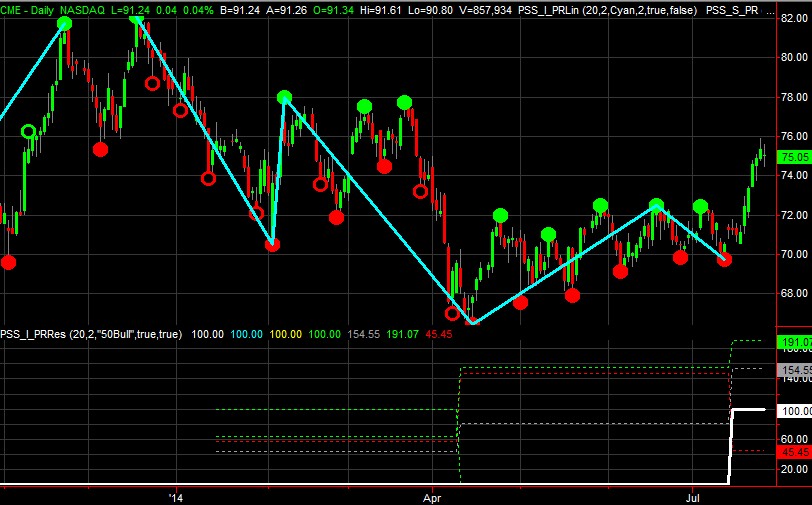
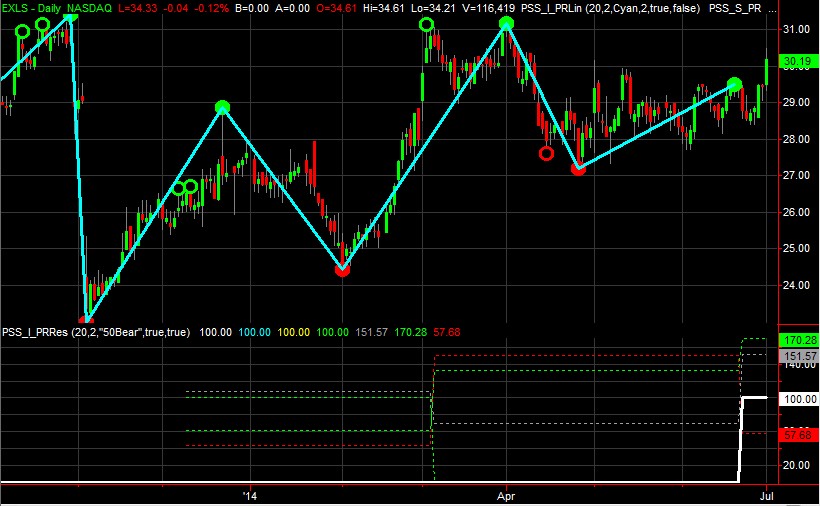
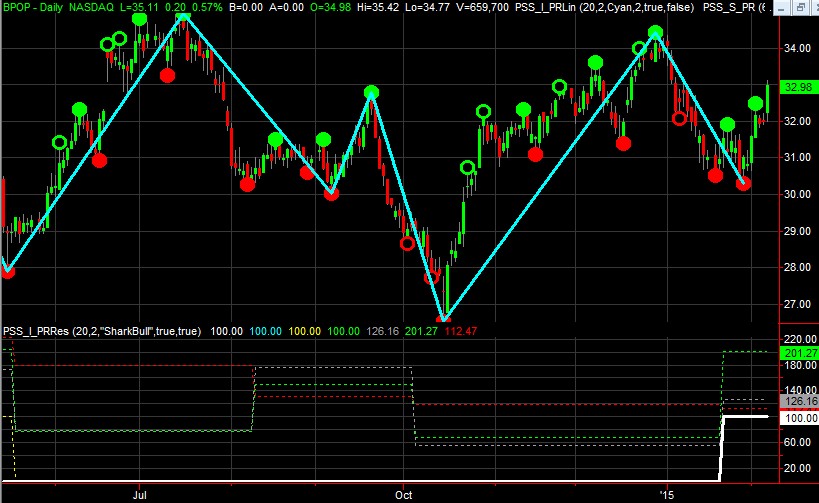
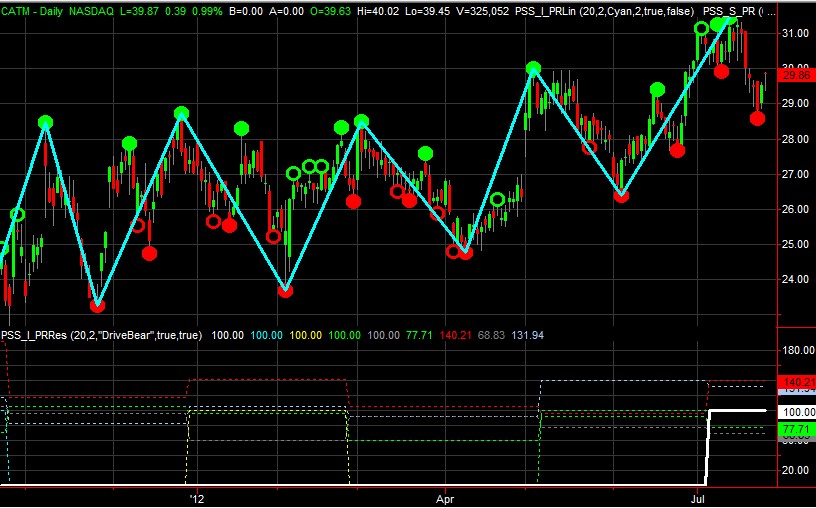
Advanced ZigZag Line Indicator
This powerful indicator assist you in quickly identifying
recent price wave ranges and patterns (like Elliot, butterfly, Gartley etc)
See the green and red dots indicate major price pivots. Dots with a black center
have been superceded by better pivots.
The cyan lines represent the major price waves - as a base for fibonacci
retracement calculations
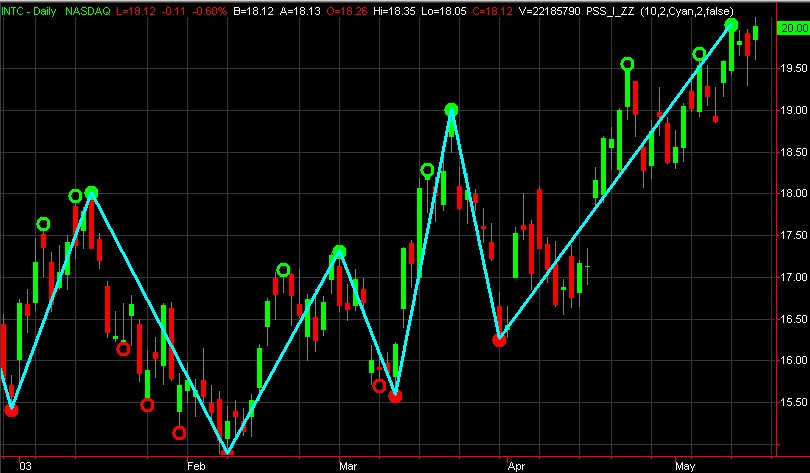
Order the Advanced ZigZag Line Indicator here
_____________________________________________________________________
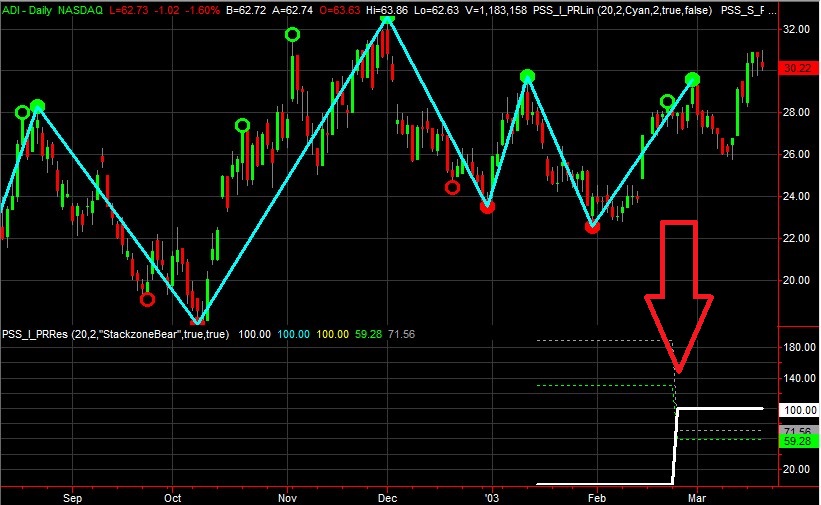
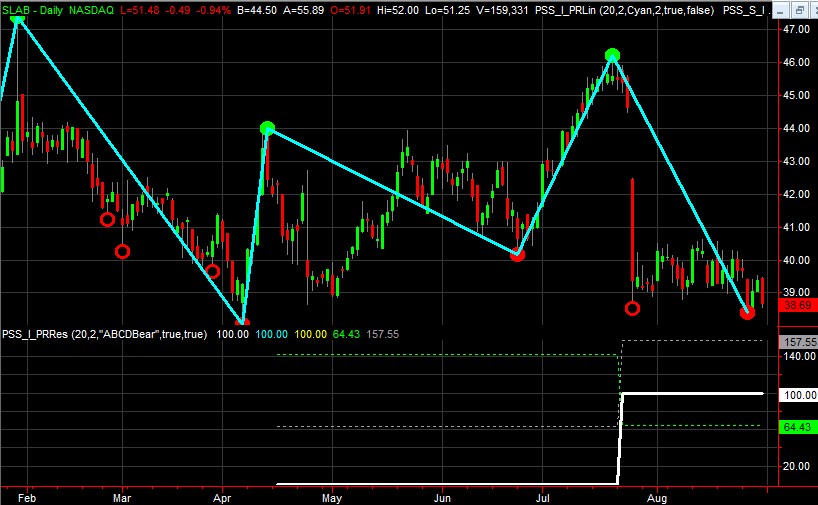
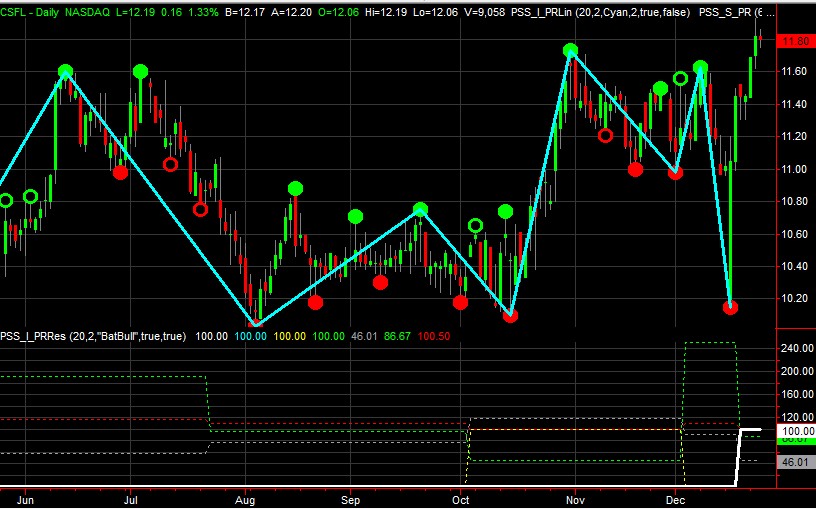
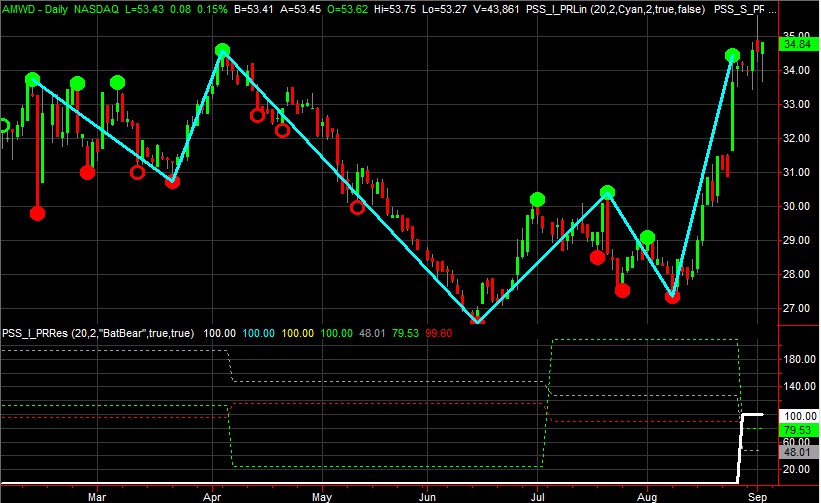
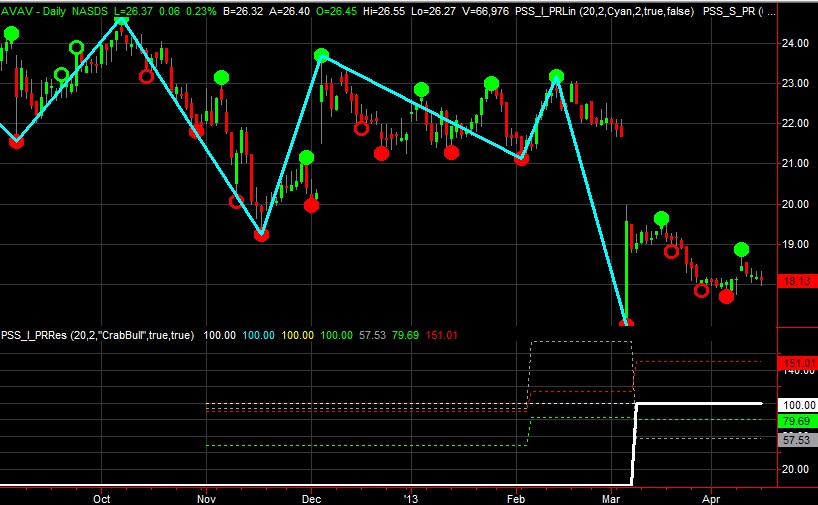
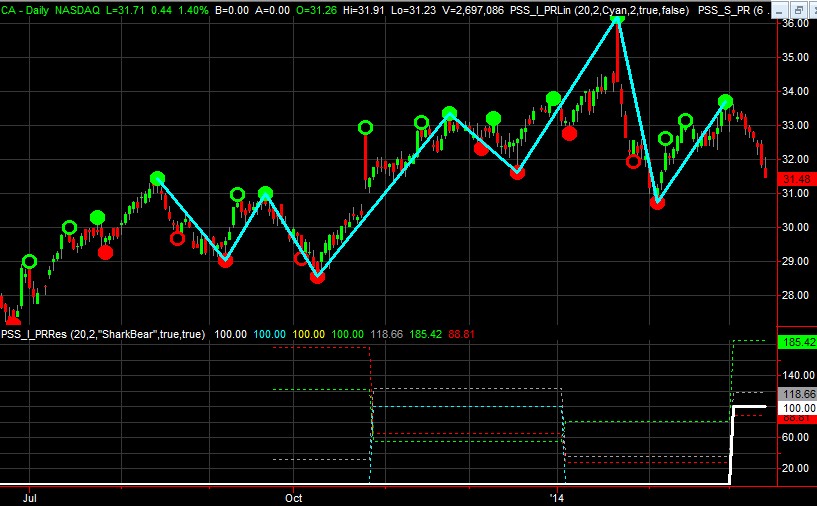
Chart Pattern Recognition & Detection Engine (PssCPRE)
The "Chart Pattern Recognition Engine (PssCPRE)" allows you automatically detect sophisticated
price and pivot patterns in Charts.
Download and Try for free
Order Detailed Example PatternList
ConfigDetails
You simply define the details in a small
pattern configuration file with the retracement ranges etc.
The "Chart Pattern Recognition Engine (PssCPRE)"
will process each bar and check for new pivots were the condition(s) you specify are fulfilled.
The "Chart Pattern Recognition Engine (PssCPRE)" can then be easily
integrated within a trading strategy or indicator!
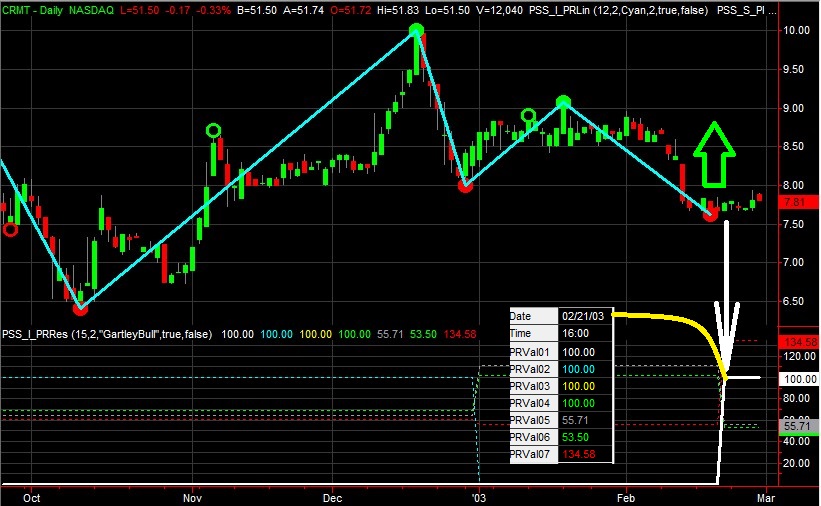
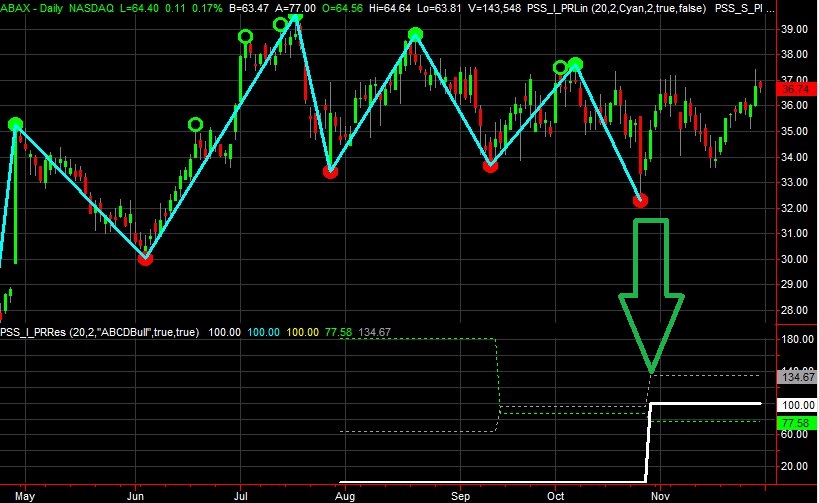
Detailed Example: Gartley Bullish
Here is an actual example of a Gartley Bullish formation (CRMT
Feb 21, 2003):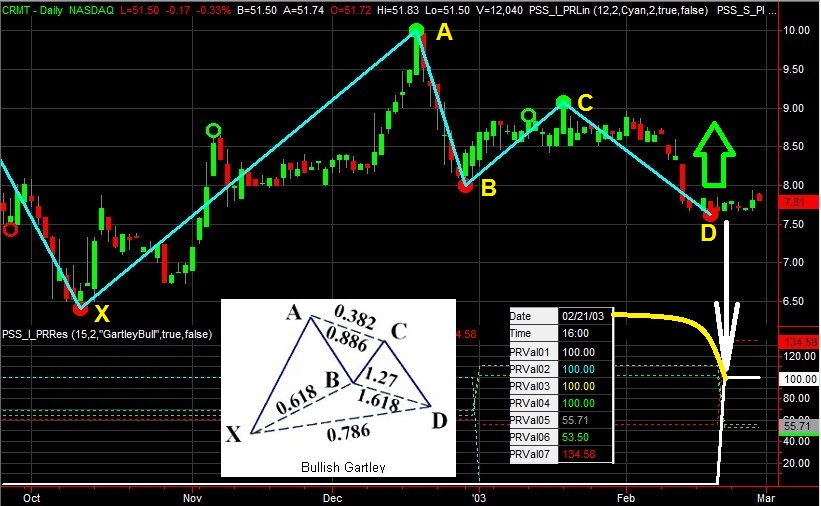 |
|||||||||||||||
The pattern
configuration file(PR_GartleyBull.txt) defines the details of the
expected formation (details below) and has several
sections:
|
|||||||||||||||
| Detailed
Diagnostics You can switch the detailed diagnostics on - by simply specifying a start date (Jan 1st, 2012) (remove the semicolon): DiagStart: 20030101 New Pivot detecetd: When a new Pivot is detected - the engine shows in the log file the detailed diagnostics: Diagnostics - Bar#708[02/21/2003 16:00]: O=7.6700, H=7.7800, L=7.6700, C=7.7700, Vol=31350 - 5 KeyPoints (Max 19): List of Pivot Points: PivotPt-X: Bar= 616, Prc= 6.4100, Dir=-1, Type=2, Exp=0, Show=0 (Bar#617[10/10/2002 16:00]: O=6.5000, H= 6.7300, L=6.4100, C=6.6300, Vol=66750) PivotPt-A: Bar= 664, Prc=10.0000, Dir=+1, Type=2, Exp=0, Show=0 (Bar#665[12/18/2002 16:00]: O=9.4300, H=10.0000, L=9.4300, C=9.9300, Vol=60750) PivotPt-B: Bar= 671, Prc= 8.0000, Dir=-1, Type=2, Exp=0, Show=0 (Bar#672[12/30/2002 16:00]: O=8.1300, H= 8.4600, L=8.0000, C=8.4100, Vol=27450) PivotPt-C: Bar= 685, Prc= 9.0700, Dir=+1, Type=2, Exp=0, Show=0 (Bar#686[01/21/2003 16:00]: O=8.6700, H= 9.0700, L=8.6700, C=9.0000, Vol=25950) PivotPt-D: Bar= 705, Prc= 7.6300, Dir=-1, Type=2, Exp=0, Show=0 (Bar#706[02/19/2003 16:00]: O=7.7900, H= 7.7900, L=7.6300, C=7.6700, Vol=6975) List of calculated Ratios: Var=DRatio1 , Formula=BA/XA Res= 55.7103 Var1= 2.0000, Var2= 3.5900 Var=DRatio2 , Formula=BC/BA Res= 53.5000 Var1= 1.0700, Var2= 2.0000 Var=DRatio3 , Formula=DC/BC Res= 134.5794 Var1= 1.4400, Var2= 1.0700 List of Conditions check if in specified Range: Cond: InRange : Var= 55.7103(DRatio1 ), Min= 50.0000, Max= 78.6000 Cond: InRange : Var= 53.5000(DRatio2 ), Min= 38.2000, Max= 88.6000 Cond: InRange : Var= 134.5794(DRatio3 ), Min= 127.0000, Max= 161.8000 Final overall Result: CalcPattern: Result=1, Type=A(And) Cnt=3(Max=3) |
Chart Pattern configuration file
| Symbols: XABCD |
Defines the pivot letters/symbols used for each pivot |
| Calc: DRatio1=BA/XA DRatio2=BC/BA DRatio3=DC/BC DRatio4=X/D |
Defines which ratios are calculated - using the symbols for the pivot points above |
| Cond: C1=DRatio1|50,78.6| C2=DRatio2|38.2,88.6| C3=DRatio3|127,161.8| C4=DRatio4|105,140| |
Defines condition(s) and the expected range(s) for a given Ratio |
| Result: AND=C1,C2,C3,C4 |
Defines which condition(s) need to be true for the overall result to be successful (true = 100%) |
| Output: C1 C2 C3 C4 DRatio1 DRatio2 DRatio3 DRatio4 |
Defines which values are show in the chart. The Conditions (C1,C2,C3 etc) are shown as 0%(False or 100%(True)
|
| DiagStart: 20030320 |
Optional switch to turn on diagnostic - showing logging with additional information from the specified starting date (YYYYMMDD) |
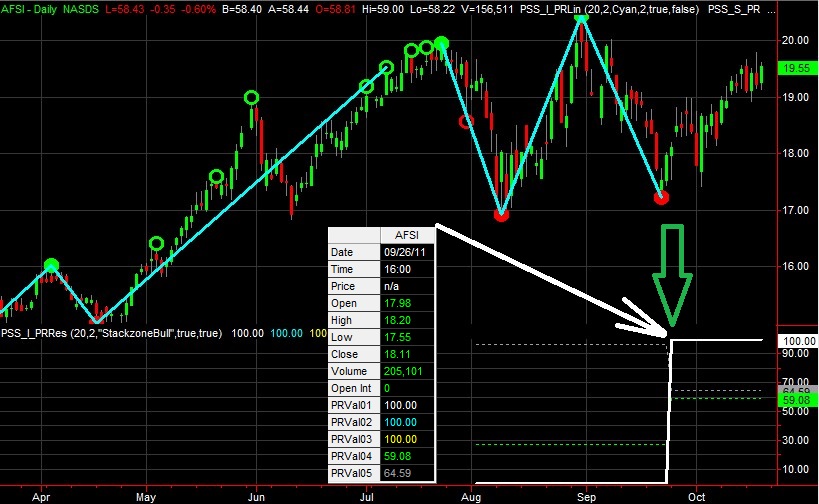
EasyLanguage code: PSS_I_PPRes
PR_TRD.txt
You can of cause use the "Chart Pivot Pattern Recognition Engine"
for trading inside a strategy! - PR_TRD.txt
Simply
check for main result of 100% - shown in the chart as "PRVal01"
Check if the new bar has triggered (value jumps from 0 to 100):
if arrVal1[0] = 100 THEN
Buy next bar at market;
Order the Chart Pivot Pattern Recognition Engine
here
Provided
Chart Recognition
Patterns:
_____________________________________________________________________
_____________________________________________________________________
Identify and find the best Strategy/Trading Entry Points/Opportunities
(FindTradingGems)
The FindGem set of indicators assist you in developing and
optimizing strategies,
by visually identifying the bars with the maximum profits (Trading Gems)
in your charts.
This helps you in your research if your indicators correlate with best entry
points or not.
In the example below we show the correlation of the CCI indicator.
FindGem inserts the Pivot points 60 bars backwards
(default Scope)
so is not meant to be used for real time trading, but for trading strategy research.
The best Long opportunities are identified with the large green dot in the
price chart and also
the yellow bar in the Long excursion indicator in the middle graph (PSS_I_FindGem_L).
The best Short opportunities are identified with the large red dot in the
price chart and also
the yellow bar in the Short excursion indicator in the lower graph (PSS_I_FindGem_S).
You can also see easily the progression of the maximum favorable(green line) and
unfavorable(red dotted line). We have included here a CCI sample which
correlates
in some cases nicely:
Order the Find Trading Gem Indicator here
_____________________________________________________________________
Bar Countdown Utility
![]()
|
Sample Screen shot of the TradeStation®
Bar Countdown Control Window: |
_____________________________________________________________________
Strategy/Indicator Speak Extension
This module allows you to generate any spoken text from
your strategy or indicators in real-time,
alerting you of any significant events - with one simple command in EasyLanguage®
like:
Try it yourself - 15 days trial period for free:
Order EasyLanguage® Speak Extension
here
To use the EasyLanguage Speak Extension install:
_____________________________________________________________________
Export any Chart Data to your Spreadsheet (CSV Format)
This indicator allows you to export any chart data into
your spreadsheet program.
You can export daily, intraday or tick data.
The export is using the standard CSV (Comma separated Value) file format.
The exported data is written to a new file for each different Symbol:
C:\Program Files\TradeStation XXX\CSV\Symbol.csv - Here is a sample:
Here
you can see an example of exported data into a CSV Spreadsheet file,
so you can access the TradeStation data from other applications or analyze the
data within your custom spreadsheets.
Try it yourself - 15 days trial period for free:
Order
the Export Data Indicator
here
TradeStation® and EasyLanguage® are registered trademarks of TradeStation Technologies, Inc.
Check out the new BeauteySphere Digital Painter
RISK DISCLOSURE:
Futures and forex trading contains substantial risk and is not for every investor.
An investor could potentially lose all or more than the initial investment.
Risk capital is money that can be lost without jeopardizing one's financial security or life style.
Only risk capital should be used for trading and only those with sufficient risk capital should consider trading.
Past performance is not necessarily indicative of future results.
HYPOTHETICAL PERFORMANCE DISCLAIMER:
Hypothetical performance results have many inherent limitations, some of which are described below.
No representation is being made that any account will or is likely to achieve profits or losses similar to those shown;
in fact, there are frequently sharp differences between hypothetical performance results and
the actual results subsequently achieved by any particular trading program.
One of the limitations of hypothetical performance results is that they are generally prepared with the benefit of hindsight.
In addition, hypothetical trading does not involve financial risk, and no hypothetical trading record
can completely account for the impact of financial risk of actual trading.
For example, the ability to withstand losses or to adhere to a particular trading program in spite of trading losses are
material points which can also adversely affect actual trading results. There are numerous other factors related to
the markets in general or to the implementation of any specific trading program which cannot be fully accounted for in the preparation
of hypothetical performance results and all which can adversely affect trading results.
ADDITIONAL DISCLAIMER:
Professional Software Solutions(PSS), also known as PSS assumes no responsibility for your trading results.
Past performance does not guarantee future performance and Professional Software Solutions does not make any performance representations or guarantees.
Any chart or trading demonstration produced by Professional Software Solutions representing trades and using any systems/methods on the www.ProfSoftware.com website
or in any advertisement, seminar, brochure, magazine or online demonstrations are to be considered hypothetical trades for educational purposes only.
No trading system can guarantee profits. Hypothetical trading results can be unreliable.
Testimonials Disclosure:
Testimonials appearing on this website may not be representative of other clients or customers and is not a guarantee of future performance or success.
© Copyright 2004-2018, Burkhard Eichberger, Professional Software Solutions - All Rights Reserved Worldwide.