Diamond Backtesting
with
Walk Forward Manager
(BTWFMgr)

the
new cutting edge in Backtesting
sharp and clear like a diamond
by
Professional
Software Solutions
(Burkhard
Eichberger)
http://www.ProfSoftware.com/bt
Copyright ã
2004-2017 by Burkhard Eichberger. All rights reserved.
No part of this book may be reproduced in any form or by any electronic or
mechanical means including information storage and retrieval systems
without permission in writing from the author (pss@poboxm)
(BTWFMgr Version 3.X)
Table
of Contents
Fully automated advanced Walk
Forward Analysis (WFA)
Innovative Volatility Analysis
Advanced Strategy Input Parameter
Analysis
Position Profit/Loss Distribution
Analysis
Innovative Trading Strategy
Potential Analysis and Optimization
Identify the best Weekdays and
Entry Intraday times
Detect the Market Long/Short Bias
Detect the Strategy Trading
Frequency
Find the best exit logic - Position
Exit Manager (PEM):
Visual Multi Timeframe/Symbol
Analysis - Result Overview Module
Integrated In depth Performance
Analyzer (PerfAna)
Export Results to Microsoft Access
Database
Correlate Context Values with best
Potential
Automated modification of your
EasyLanguage Strategy Code
Equity/Walk Forward Mode
(nBTWFMgrExport=2)
Potential Mode (nBTWFMgrExport=1)
Data Collection turned off
(nBTWFMgrExport=0)
BTWFMgr Configuration and
Preferences
Step1 – Strategy Preparation &
TradeStation® Optimization
Step2 – Detecting the optimal
Strategy Potential/Parameters
Step3 – Detecting the optimal
Strategy Exit Method
Step4 – Detecting the optimal
Strategy Result
Step5 – Walk Forward
Analysis/Optimization (WFA)
Walk Forward Analysis Overview
Walk Forward Analysis Setup Module
Walk Forward Analysis – Filter
Definition (Step1)
Walk Forward Analysis – Sort
Definition (Step2)
Walk Forward Analysis – Defining
the Period Setup/Sequence
Defining a sequence of walk forward
Period setups
Walk Forward Analysis – Check your
Save Result Options
Walk Forward Analysis – Starting
Walk Forward Analysis
Walk Forward Analysis – Treeview
Display
View best WFA Drawdown, Volatility,
ProfitFactor and Robustness
Preparing TradeStation® - Opening
your Strategy Code
Adding the BTWFMgr Data Collection
Section
Sample of Data Collection Section
Detecting the optimal Strategy
Potential/Parameters
Analyzing the Strategy Per Trade
Potential
Analyzing the Strategy Yearly
Potential
Analyzing the Strategy Parameter
Potentials
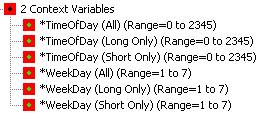
Analyzing the Strategy Context
Variables
Detecting the optimal Strategy Exit
Method
Analyzing the Strategy Exit Results
Analyzing the Strategy Exit
Parameters
BTWFMgr Configuration and Preferences
Smart Ranking Analysis Settings
Best Trade Permutation Analysis
Settings
Walk Forward Analysis+Optimization
Settings
Strategy Potential &
Probability Analysis Settings
Initial Data Conversion Settings
Position Exit Manager (PEM)
Settings
Introduction to BTWFMgr
Developing
a successful trading strategy is a craft - some might even say an art.
You
will need the right tools to be able to test, evaluate and optimize your
trading strategies.
To
assist you in this task and adventure - we have developed a new powerful
software tool:
”Diamond Backtesting with Walk Forward Manager”
– or in short BTWFMgr.
For more current information and to download go to http://www.ProfSoftware.com/bt
We have grouped the BTWFMgr manual into the following chapters:
·
Overview
Presents the main BTWFMgr functions with a brief description
·
BTWFMgr Basics
Introduces you to some basic concepts of BTWFMgr and
shows you how to get started and some basic BTWFMgr functions
·
Strategy Development
Describes some basic concepts how strategies can be developed (using BTWFMgr)
·
Function Reference
Here we show you each BTWFMgr function in greater detail
·
Licensing & Ordering
Details
about ordering BTWFMgr and licening
·
Installation
Step-by-step
guide how to install BTWFMgr
·
Glossary
Explains
basic terms and abbreviations used in this BTWFMgr manual
We
hope you will find BTWFMgr a valuable tool and invite your feedback at: pss@pobox.com
Check
frequently for updates – as we continuously improve and expand BTWFMgr at:
www.profsoftware.com/bt/dl.htm
BTWFMgr works for example with the TradeStation Open Platform® (TradeStation.com)
and enhances one of the most powerful trading and strategy research
platforms available
which seamlessly integrate the charts and strategy and fully automated
executions.
Overview
Below
we will introduce you to the main functions BTWFMgr is offering you,
so
you can analyze and improve your strategies.
For more details on each function use the Reference Chapter
Fully automated advanced Walk Forward Analysis (WFA)
Provides
you with a powerful, more realistic backtesting method, testing essentially the
predictability/robustness, instead of the usual unrealistic curve fitting
optimization,
saving you hours or even days of cumbersome calculations. Below is a 4
week/1week example:

All
aspects of the walk forward analysis can be customized:
Filter, Sort, In/OutSample Sequences/Clusters - using intuitive Filter/Sort and
Period Manager interfaces.
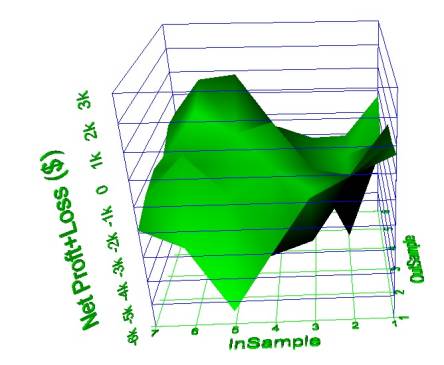
Walk
Forward Analysis Results can be shown even in a 3D cluster view
presenting in this example the correlations between in and out sample
variations:
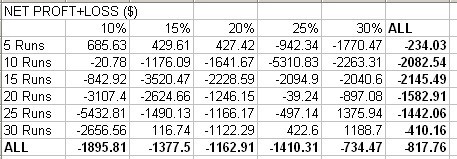
Also
results can be viewed as a spreadsheet/2D view.
Below is an example showing the clusters (using 5 to 30 runs and 10 to 30% out
of sample):
These
Walk forward result views can use any of the many statistics available:
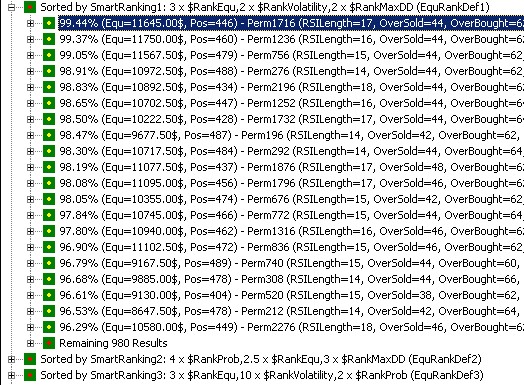
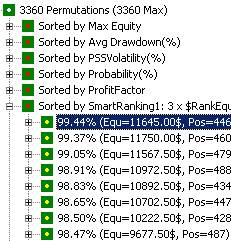
Smart/Hybrid Ranking
Finds
you the best backtesting results by combining your most important
(customizable) sort criteria into a hybrid. Below is an example using
Equity(3x), Volaitility(2x) and Drawdown(2x):
![]()
The ideal result would be at the top in all sort criterias = 100%,
below is an example, showing the smartranbking, with the best hybrid result
(99.44%) on top:
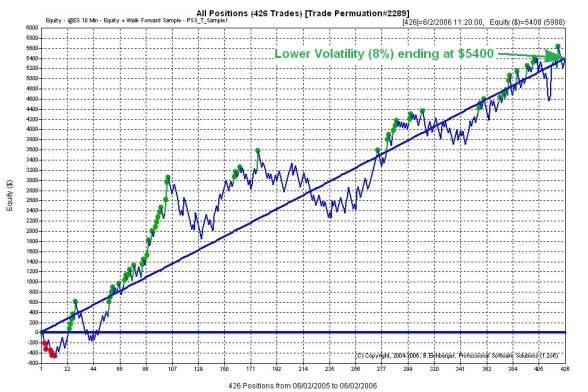
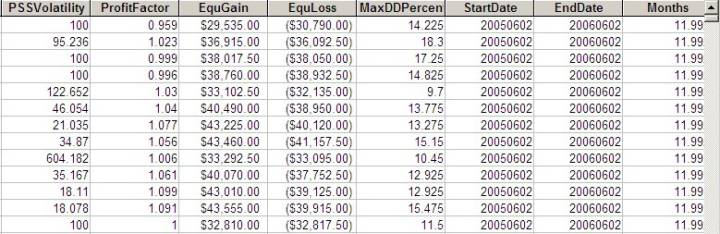
Innovative Volatility Analysis
For
most traders a fairly predictable, smooth equity graph is preferable to
an equity graph with wider swings, but a higher ending equity. The innovative
volatility analysis measures the “swing” around the smooth equity income line.
Below is an example of the fairly smooth equity graph:
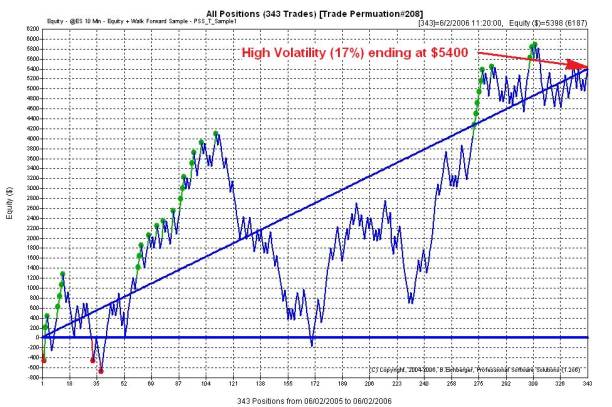
below
we see the same ending equity($5400) but a much higher volatility(17%) and
wider “swings”:
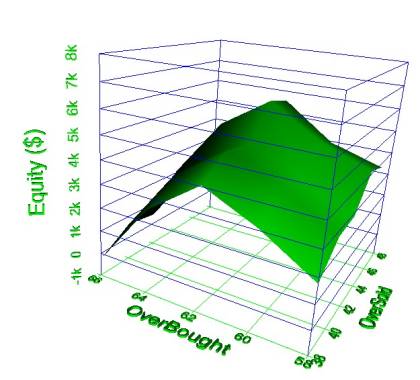
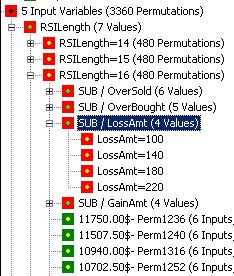
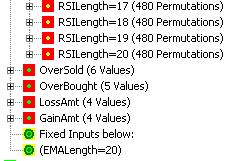
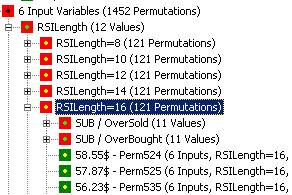
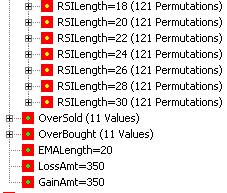
Advanced Strategy Input Parameter Analysis
Shows
you a detailed visual analysis of the effect of EACH strategy input parameter
variations on the overall result, below is an example in 3D view, combining RSI
oversold and overbought parameter:
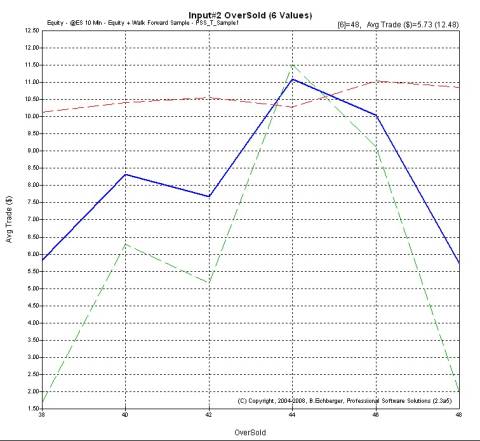
Also
a 2D graph is available - showing the overall(blue),
long(green) and short(red)
effect of each parameter value on the overall result:
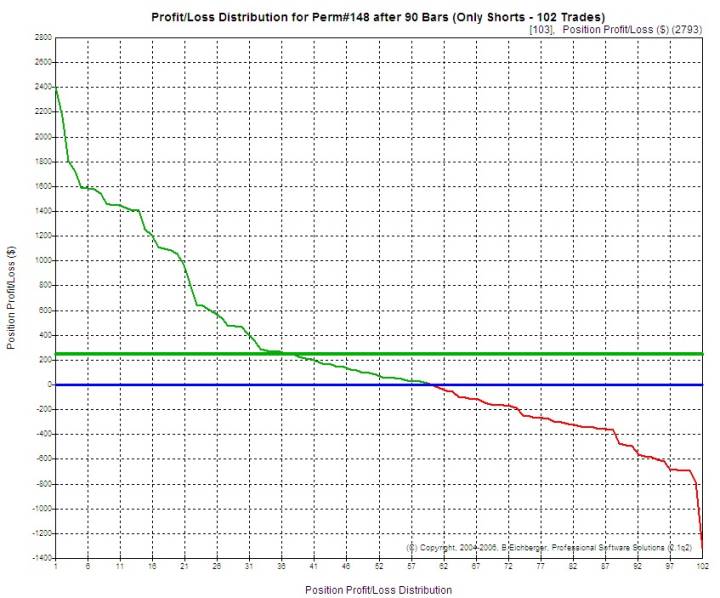
Position Profit/Loss Distribution Analysis
Helps
you detecting misleading outliers in your equity graph:
ranking winners(green) and losers(red) – and showing the overall average line at
$240:
Innovative Trading Strategy Potential Analysis and Optimization
Track
how the market response on average to your entries (Potential Analysis),
helping
you to detect the maximum trading opportunities and finding best entry points,
using
ONLY ENTRY POINTS, before you focus on develop the exit logic in your strategy.
Below is an example of a stable gain:
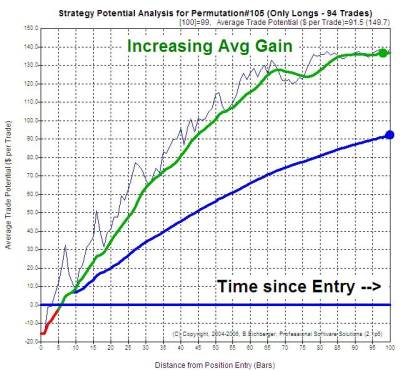
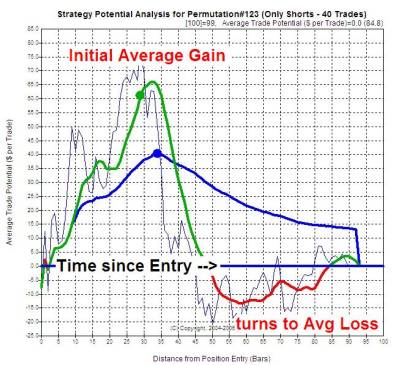
and
an example of a gain which expires after around 45 bars since entry:
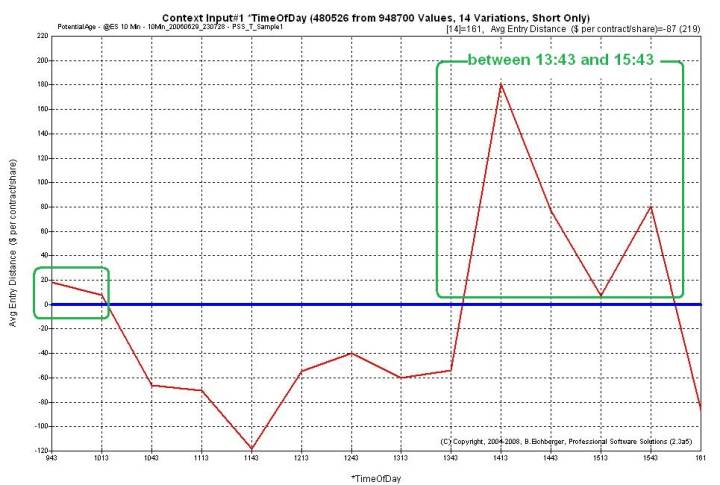
Equity Intraday Time Analysis
Identify
the best intraday trading times of your startegies.
In the “Equity Time Analysis” sample below
we see that 9:43 to 10:13 and 14:13 to 15:43 are the best trading times:
(You
can adjust the time interval in the configuration: Treeview/EquTimeLength - the
default is 30 minutes)
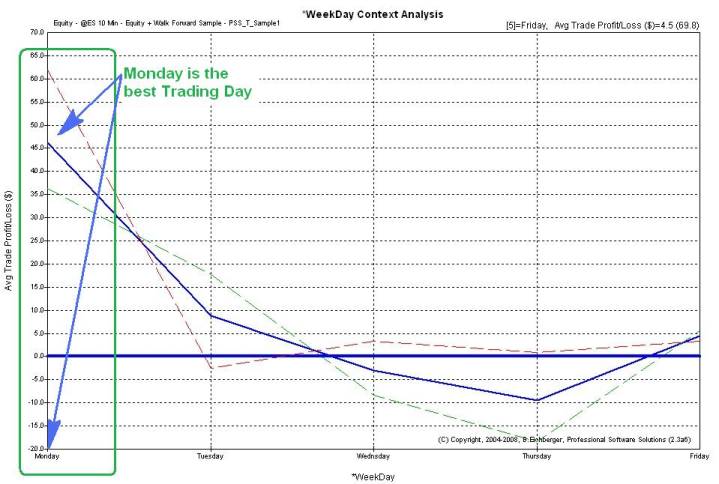
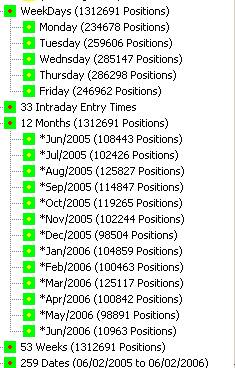
Identify the best Weekdays and Entry Intraday times
This
function allows you identify the best weekday to trade - for all(blue), long(green)
or short(red).
In
the sample below we can see that Monday is the best trading day:
Detect the Market Long/Short Bias
This
function allows you to detect the general long(green)
or short(red) bias (if any)
of your strategy performance. Also periods of strategy sub performances are
shown:
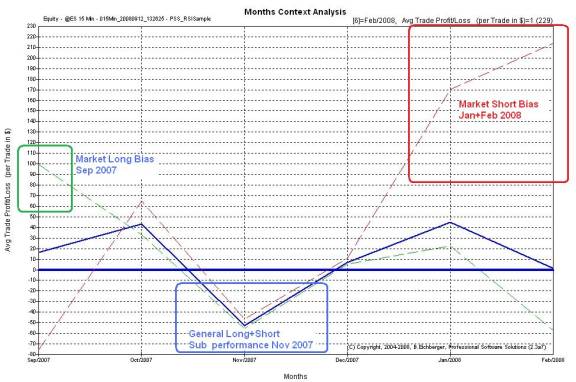
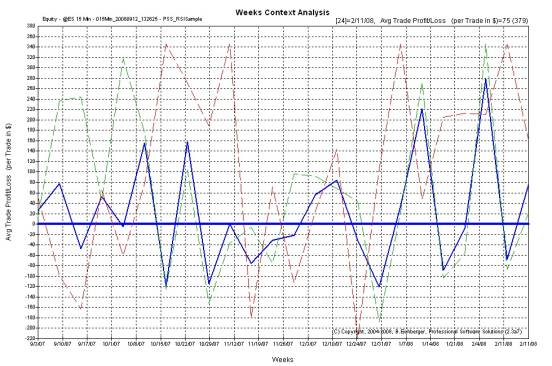
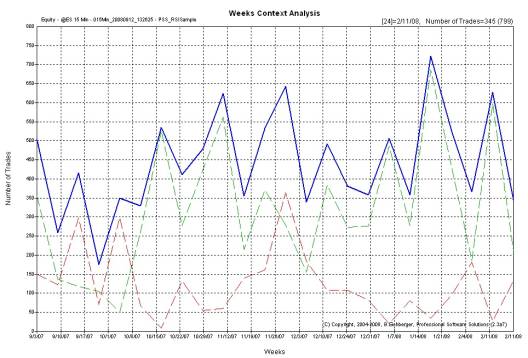
You
can also use a more detailed weekly market long/short bias analysis:
Detect the Strategy Trading Frequency
This
function allows you to detect how frequently your strategy is trading over
time,
separated by long(green), short(red) and total
trades(blue):
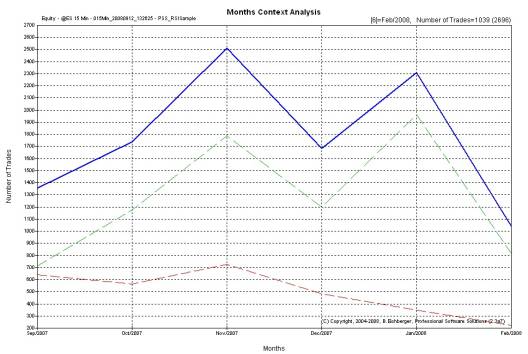
You
can also see the more detailed weekly (and even daily) frequency analysis
Find the best exit logic - Position Exit Manager (PEM):
After
you have identified the best strategy entries with the best potential, you can
test millions of exit logic variations, using the integrated high speed
(100,000/second) Position Exit Manager (PEM),
to detect the best way to exit. You can use any combination of various exit
functions:
Exponential+Linear
Target, Exponential+Linear StopOut, Trailing, breakeven, age etc.
Below we see a visual example how PEM can manage your positions:
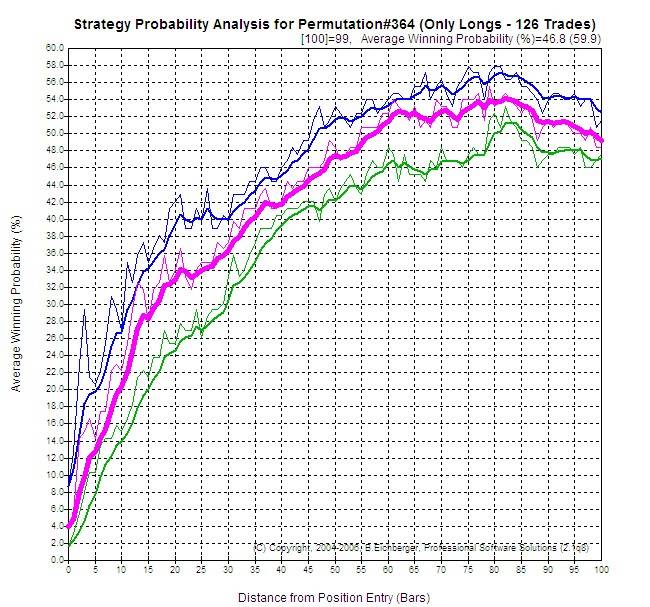
Strategy Probability Map
The
"probability map" function, allows you to detect the best probability
areas,
in the time based market response (Potential) analysis.
Below we can see an the best probability is reached after 75 bars,
for the three (customizable) target levels: $50(green),
$100(magenta), $150(blue):
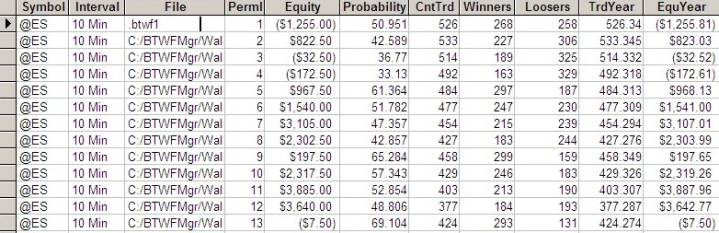
Visual Multi Timeframe/Symbol Analysis - Result Overview Module
After
you have run several backtests for a strategy across symbols and/or timeframes,
you
can quickly detect the best performance using Probability%, Yearly, PerTrdAvg
or PeakAvg$,
calculated
separately by long/short or merged trading,
below
is a screen shot with the best probability results for shorts:
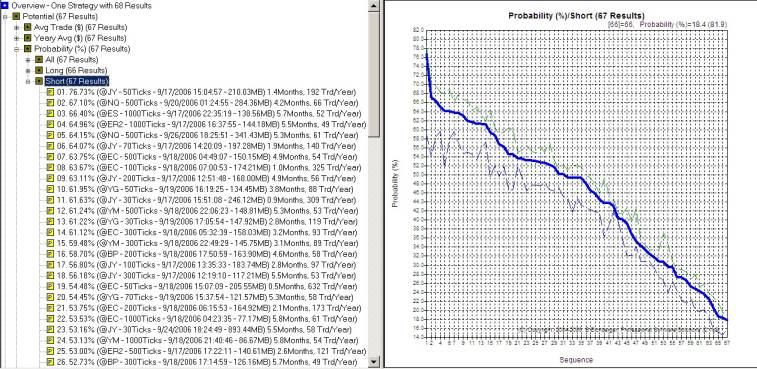
In
the chart three lines are shown:
·
green
thin line = single top result
·
blue
thick line = average of the top 10 results
·
blue
think line = avgerge of the top 100 results
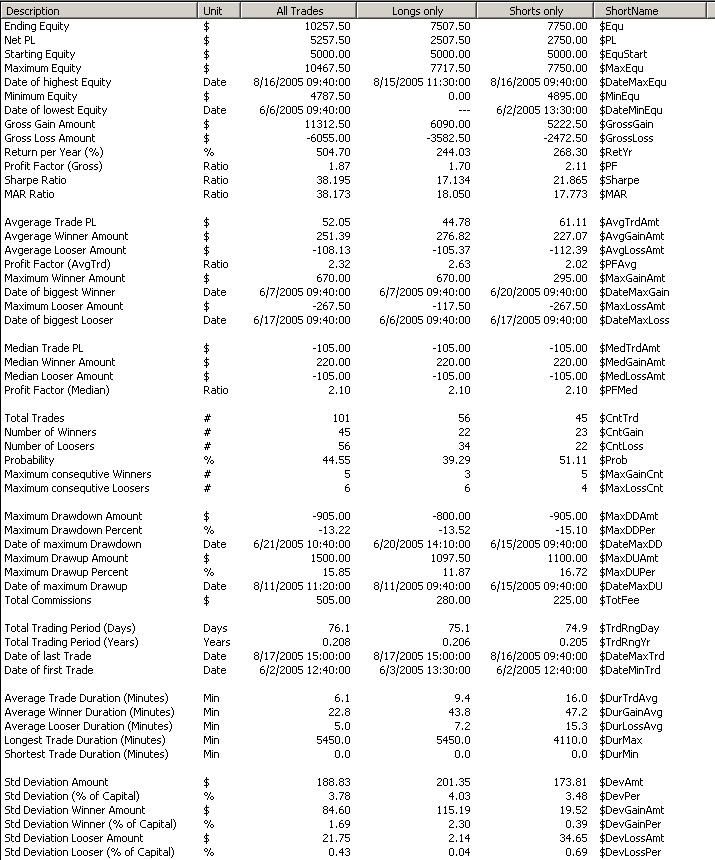
Integrated In depth Performance Analyzer (PerfAna)
This
additional module allows you to perform many in depth equity result operations
and statistics
and also export the trades to a spreadsheet – below is a statistic analysis
view:
You
can merge results from different markets/symbols into one new comprehensive
result/graph
with the Performance Analyzer module.
Export Results to Microsoft Access Database
This
function allows you export the permutation data to a standard microsoft access
database.
Then you can apply any advanced SQL queries and/or reports to process and
detect the best results:
(just
enable the export by setting Setting System/ExportTrdPer to YES and the next
time you open an equity result - all permutations will be exported)
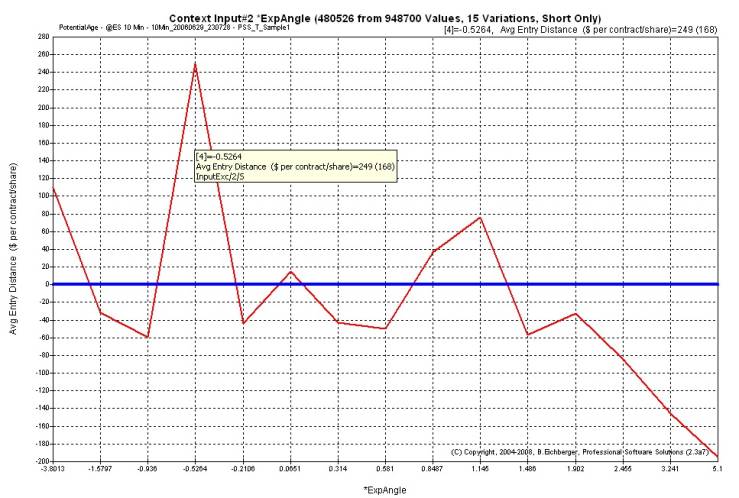
Correlate Context Values with best Potential
You
can add any variable in Potential Mode to the backtesting, so you can detect
any correlation between context variable range(s) and favorable potential
results.
In the example below, we use the angle exponential average (see PSS_RSISample
workspace),
detecting that slightly downward angle (around minus 0.5264) offer the best
returns for shorts(red):
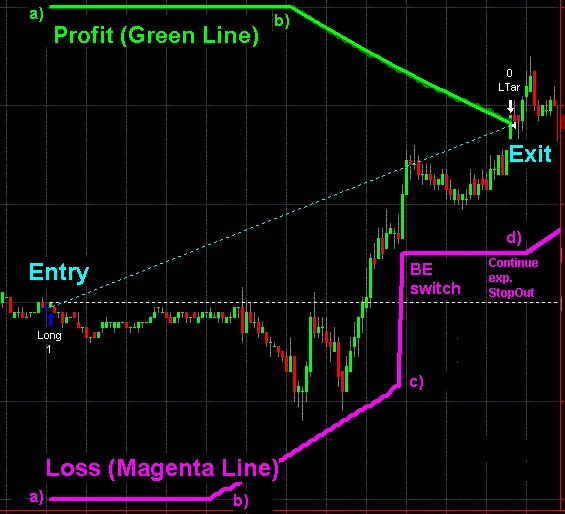
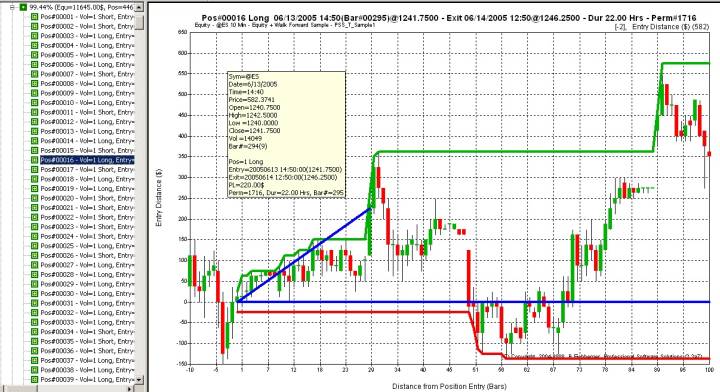
Instant Position Viewing
Provides
you - with a mouse click - with the actual charts of each Position Entry, Exit
and Risk/Reward excursion instantly, so you can evaluate also visually all
entries and their performance - instead of using the cumbersome scrolling in
the charts – in the example below we see:
a) the horizontal blue line (entry price)
b) maximum favorable excursion (green line)
c) maximum unfavorable excursion (red line)
d) Exit price (end of diagonal blue line):
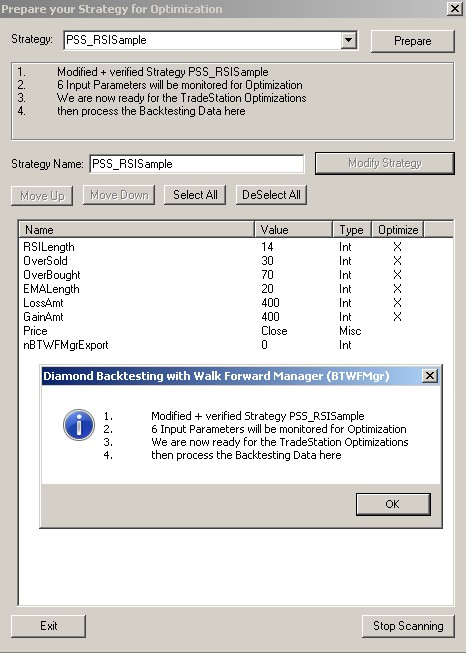
Automated modification of your EasyLanguage Strategy Code
This
function completely automates the preparation of your strategy EasyLanguage
code,
so BTWFMgr can collect all the trades data during the optimization.
(you don't have to be familiar at all with EasyLanguage!)
Below is the interface through which you can modify your strategy code
(PSS_RSISample):
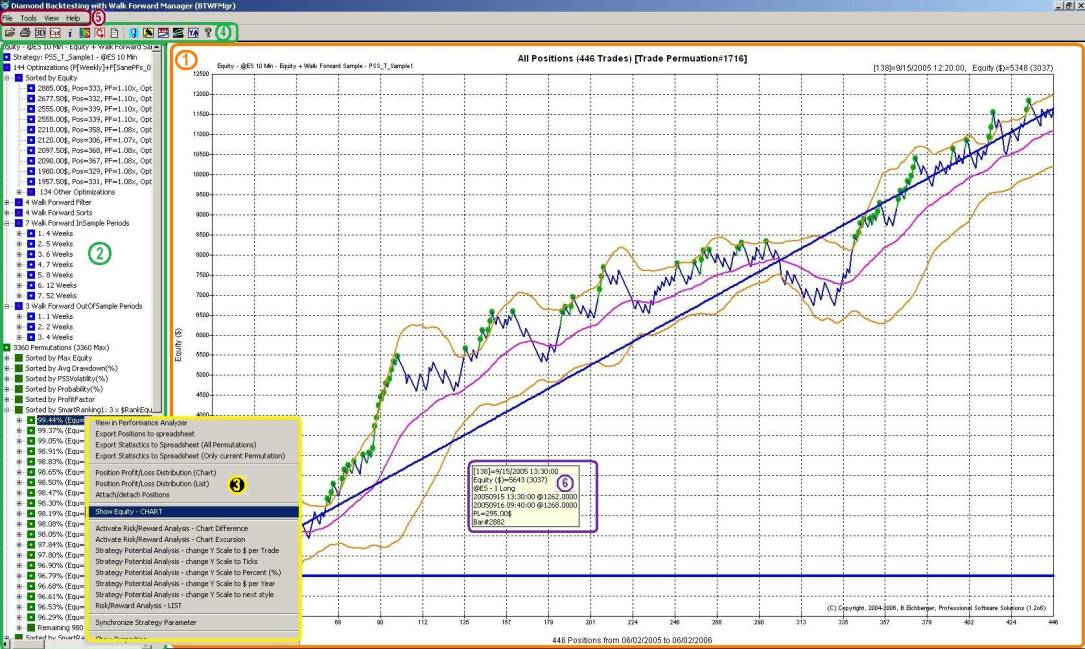
BTWFMgr Basics
BTWFSMgr Software Layout
BTWFMgr
is using a very visual approach, which (hopefully) makes working with BTWFMgr easy+intuitive.
Similar to the windows explorer, all relevant items are shown in a window on
the left side (treeview),
were can “zoom” in or out any item. The “display”
shows the current details as a chart or even 3D View.
|
Main Display (1) |
shows
the chart, list or 3D view for the current item from the treeview |
|
Treeview Area (2) |
Shows
the items for the current backtest data in “branches” and subbranches. |
|
Pop-up Menu(3) |
The
list of specific functions for the currently selected element/item. |
|
Toolbar(4) |
List
of the main functions – using icons - accessible via one mouse click |
|
Menu(5) |
All
available functions - accessible via the standard Windows menu interface |
|
Tooltip window(6) |
A
small white window popping up when you move the cursor in the main display |
BTWFMgr Operating Modes
BTWFMgr operates in two main modes:
a) Equity/Walk
Forward Mode: entry and exit points are used for an equity graph for each
permutation
b) Potential
Mode: only entry points are used to detect the best market response for each
permutation
When running the optimization, simply
set the “nBTWFMgrExport” strategy parameter to 2(Equ) or 1(Pot).
See “Strategy Preparation” for
details how to prepare your strategy for BTWFMgr.
Equity/Walk Forward Mode (nBTWFMgrExport=2)
This is the main mode, were the strategy generates entries AND exits automatically, applying the “Strategy Entry+Exit Logic” for trading decisions. In this “Equity(Equ)” mode, we are optimizing the Equity and overall Strategy results and can run the advanced walk forward analysis, testing predictive-ness.
BTWFMgr comes with an equity sample
“out of the box”, so you instantly can test drive BTWFMgr:
Start/Programs/Diamond
Backtesting/Sample Equity + Walk Forward Analysis
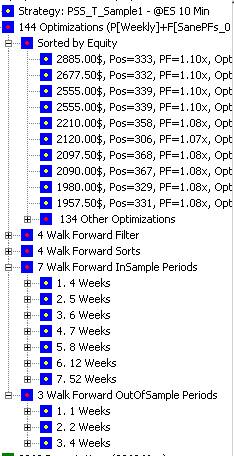
Below are the main Treeview branches
showing the results (more details in further chapters):
|
Title |
|
at the very top showing the symbol,
time frame and the description. In this example: |
|
Walk Forward Optimization
Results |
|
Showing the top 10 Walk Forward
results; Equity total. attached under “134 Other
Optimizations” |
|
Strategy Overall |
|
Showing the overall results or each
permutation. ·
Sorted by Max Equity ·
Sorted by Average Drawdown (%) ·
Sorted by PSSVolatility (%) ·
Sorted by Probability (%) ·
Sorted by ProfitFactor ·
Sorted by SmartRanking1
(Custom Hybrid1) ·
Sorted by SmartRanking2
(Custom Hybrid2) ·
Sorted by SmartRanking3
(Custom Hybrid3) ·
Sorted Permutation Sequence
Number Here you can find out the best
overall results. |
|
Strategy Input Parameter Analysis |
|
In depth Analysis of strategy input
parameter: b) each
individual input parameter c) each
input parameter value d) even
their respective sub values Here you can detect the optimal
parameter range. |
|
Context Parameter Analysis |
|
In this section we track the overall
effect of each |
Potential
Mode (nBTWFMgrExport=1)
This is the initial mode in your
strategy development – only the “Strategy Entry Logic” is used -
which creates the entry points (buy/short) – the exit logic is not yet used.
BTWFMgr analyzes for you how the market
responded – on average – to each series of entries -
generated by each input parameter permutation. This response is shown in the “Strategy
Potential Graph” – allowing you to see how far your strategy potential
moved and how long the move lasted.
BTWFMgr comes with an potential sample
“out of the box”, so you instantly can test drive BTWFMgr:
Start/Programs/Diamond Backtesting
…(BTWFMgr)/ Sample_Strategy_Potential_Analysis
Below are the main Treeview branches
showing the results (more details in further chapters):
|
Title |
|
Shows the details of the backtesting
data: |
|
Exit Optimization Results |
|
Showing the top 10 exit optimization
results |
|
Exit Parameter Analysis |
|
This section shows you the effect of
each exit logic element on the overall result. |
|
Strategy Potential Analysis |
|
This section allows you to find the
best strategy potential and also the extend and duration of the market
response on average(potential). The strategy potential for each
permutation in the backtest is shown and |
|
Strategy Input Parameter
Analysis |
|
This section allows you to track the
effect of each strategy input parameter on the potential and detect the
optimal parameter range. |
|
Strategy Context Variables Analysis |
|
Here you can detect if certain ranges
of additional context variables can filter out adverse results and improve
the performance, Example: |
Data Collection turned off (nBTWFMgrExport=0)
To turn of the data collection OFF, simply
set nBTWFMgrExport to 0 in the strategy before running the backtest
optimization. This might be useful when for example the BTWFMgr trial period
has expired.
BTWFMgr Location+Files
By
default BTWFMgr is installed to the C: drive into the C:/BTWFMgr folder.
All sub folders are created underneath this BTWFMgr “home” directory.
Each strategy has its own sub folder, with another subfolder for each symbol:
Example: C:\BTWFMgr\PSS_RSISample\@ES
Each backtest generates its own data files:
Examples:
C:\BTWFMgr\PSS_RSISample\@ES\015Min_20080912_132625.btwf1+2 (Equity data)
C:\BTWFMgr\PSS_RSISample\@ES\P_015Min_20081110_135126.btwf1+2 (Potential data)
{Result} is used below for the basic folder and
name of a backtest result - Example:
C:\BTWFMgr\PSS_RSISample\@ES\P_015Min_20081110_135126
Basic BTWFMGR files
Each
backtest generates the following files:
a)
BTWFMgr
Backtesting Definition File (btwf1)
contains general backtest information
b)
BTWFMgr
Backtesting Event Data File (btwf2)
contains the raw trading events, like buy/sell
c)
BTWFMgr
Backtesting Position Data File (btwf3)
contains the compacted trading information derived from the btwf2 file
d)
BTWFMgr
top results File ({Result}-Best.CSV)
contains the result overview as a small spreadsheet,
which is used by the BTWFMgr overview module
to compare the various markets and timeframe results
BTWFMgr additional Files
In addition the
following files are generated by various functions:
·
BTWFMgr
Result Distribution File ({Result}-Equ.CSV)
Listing all permutations for the selected sort criteria
·
BTWFMgr
Permutation Database ({Result}.MDB)
Exporting the statistics for each permutation to a Microsoft access database
for further processing
and even advanced SQL queries on your results
·
BTWFMgr
“long only” Position Data File ({Result}-L.btwf3)
Extracted all the long positions from the {Result},
to identify the best results for the long side
·
BTWFMgr
“short only” Position Data File ({Result}-S.btwf3)
Extracted all the short positions from the {Result}m
to identify the best results for the short
side
BTWFMgr Walk Forward Files
The Walk Forward
Analysis(WFA) generates its own folder and files within/underneath it:
·
BTWFMgr
Backtesting WFA Data File (btwf4)
contains the details of the Walk Forward Analysis(WFA)
Example: {Result}\P[Daily]+F[PFCheck3]+S[SortMix1].btwf4
·
BTWFMgr
Backtesting WFA equity overview File (CSV)
contains the WFA results sorted by ending OSA equity:
Example: {Result}\P[Daily]+F[PFCheck3]+S[SortMix1].csv
·
BTWFMgr
Backtesting WFA Result overview File (-Results.CSV)
contains the details for each WFA result:
Example: {Result}\P[Daily]+F[PFCheck3]+S[SortMix1]-Results.csv
·
BTWFMgr
WFA log files (CSV)
contains the various log file for each Walk Forward Analysis(WFA).
A new subfolder is generated:
Example: {Result}\P[Daily]+F[PFCheck3]+S[SortMix1]\XXX
A
special process allows you to migrate the BTWFMgr “home” directory to another
drive
(see
the “General/DRIVE” Configuration setting).
BTWFMgr Configuration and Preferences
BTWFMgr allows you to easily change
almost all of its internal parameters,
so you can tailor the behavior to your needs.
To start the configuration, simply click on the ![]() icon
in the toolbar –or- Ctrl+C –or-
icon
in the toolbar –or- Ctrl+C –or-
select or from the in the Menu: File/Backtesting Configuration and Preferences
(Ctrl+C)
All parameters are organized by topics:
·
TreeView
·
Smart Ranking Analysis
·
Best Trade Permutation Analysis
·
Walk Forward Optimization
·
Strategy Potential & Probability
Analysis
·
Initial Data Conversion
·
Position Exit Manager (PEM)
·
General
·
Chart
Below each topic the associated
parameters are attached. You can expand and collapse each topic,
by clicking on the plus or minus mark (![]() and
and ![]() ) in front of the topic.
) in front of the topic.
To see a more detailed description -
click on the parameter,
and the right window section will show the description and current setting -
You can now:
·
Change the parameter value (simply
enter/select the new value and click on “Apply”)
·
Restore to the previous setting – after
an erroneous change for example – click on “Restore”
·
Switch to the parameter default value –
click on “Default”
Close the Configuration Window via the
“Close” button, the ESC key or the ![]() window button.
window button.
The new parameter settings is shown
with a star and activated next time you open BTWFMgr again.
A detailed description of each parameter is below in the “reference section”.
Below is a sample screen of the BTWFMgr Configuration and Preference Window:
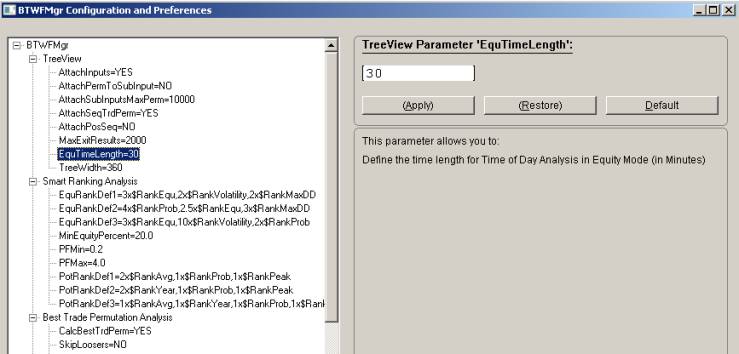
(You can also edit the configuration parameters directly in the
C:/BTWFMgr/BTWFMgr.ini file)
BTWFMgr Toolbar
BTWFMgr
offers many functions directly from the toolbar:
![]()
Below is a list of each function available from the toolbar:
|
ICON |
Shortcut |
Description |
|
|
Ctrl+O
|
Open
a new BTWFMgr data file (btwf1) |
|
|
File/Print |
Print
current view |
|
|
Ctrl+3 |
Shows
Results in 3D View |
|
|
Ctrl+R |
Runs
the Walk Forward Analysis(WFA) in Equity Mode |
|
|
Function/Show
Data Properties |
Shows
the properties for the current data set |
|
|
Function/Split
into Long/Short |
Creates
new data sets for longs/shorts only |
|
|
Function/Recalculate
data set |
Recalculates
the current data set with changed parameters |
|
|
Function/Result
Distribution |
Activates
the Result Distribution function |
|
|
Function/Create
Overview |
Activates
the BTWFMgr overview module to |
|
|
Function/Prepare
your strategy |
Activates
the module to prepare your strategy for BTWFMgr |
|
|
Function/Configuration
and Preferences |
Set
Configuration and Preference parameter |
|
|
|
Switch
between Equity and Draw Down Chart Style |
|
|
|
Switch
Bollinger Band Display on/off |
|
|
|
Change
the Y Scale display to the next available style |
|
|
Help |
Activate
the BTWFMgr Help Module + License Manager |
BTWFMgr Licensing
BTWFMgr
comes with a free 15 days trial period – offering full functionality.
Check your BTWFMgr license status via: Help/BTWFMgr License Manager –or-
Start/Programs/Diamond Backtesting …/License Manager
After the trail period expires - order your BTWFMgr subscription online at:
http://www.profsoftware.com/bt/order.htm
BTWFMgr
is available at a minimal cost in convenient 3, 6, 12 and 24 month
subscriptions or unlimited.
We offer discounts for longer subscriptions and grouping orders together for
other users or computers.
Over the long run the most economical is the outright/unlimited mode.
Each BTWFMgr license is on a per computer basis and not transferable.
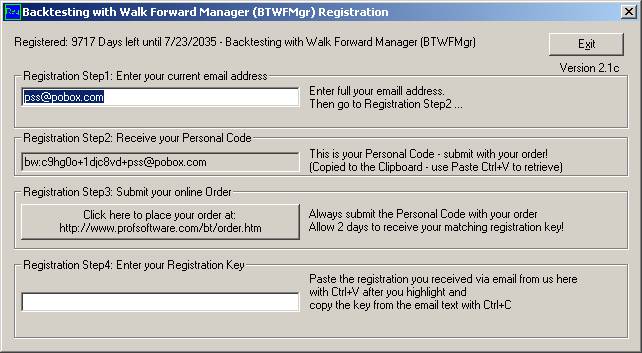
You can request a trial extension – send us via email us the personal code:
Example: bw:c9hg0o+1djc8vd+pss@pobox.com
During the trial period - you have 10 free data conversions available.
Before the next of the 10 conversions is used up - a confirm box will appear:
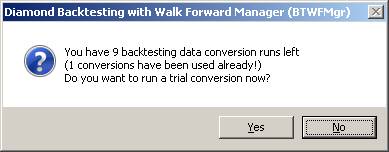
click YES to use the next of the 10
trail data conversions - otherwise click NO.
Machine Replacement or Upgrade
While
BTWFMgr registration keys are purchased specifically for a single computer, PSS
may, at our discretion, allow you to transfer a serial number to a new or
upgraded computer. Such transfers will not be allowed at a rate of more than
once per 6-month period, and proof of ownership of a new or upgraded computer
(such as an invoice or receipt) will be required along with a signed statement
requesting the transfer. Contact us at pss@pobox.com if you would like to
request a BTWFMgr license. This transfer option does not in any way alter or
override the End User License Agreement (EULA) stating that a registration key
is purchased for one machine only.
Strategy Development
Below
we are presenting to you briefly the key concepts used in the BTWFMgr.
In few basic steps we show you how to quickly develop and test your strategy
with BTWFMgr.
Each Trading Strategy has two major elements:
·
Strategy Entry Logic – when to enter a position (buy/short)
·
Strategy Exit Logic – when to exit/reverse a position (sell/cover)
Strategy development starts in most cases with defining just the entry
condition(s) and then
translating those rules into the ”Strategy Entry Logic“ (i.e.
EasyLanguage® from TradeStation®).
BTWFMgr
allows you to optimize initially only the entry logic, without any exit logic
yet,
so you can identify initially the best entry points which yield the best “Strategy
Potential” (see below).
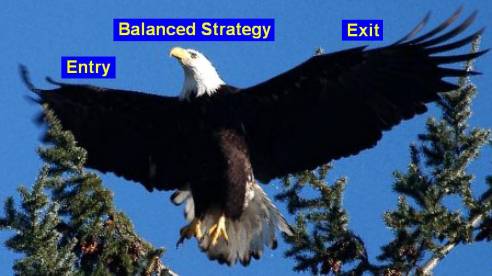
Once
the best “Strategy Potential” has been identified you can then move on
to the other “wing”
of
your strategy, which defines the most profitable way to exit the entries: the ”Strategy
Exit Logic“.
Only
when both “wings” of your strategy – entry AND exit - are independently strong
and healthy,
can your strategy “take flight” and can give you consistent profitable results.
BTWFMgr,
unlike all other backtesting software tools, does not force you to prematurely
include the exit logic, but allows you to first test only the entry logic
(Potential Mode) and then later
the entry AND exit (Equity Mode), so you can optimize each element
individually.
BTWFMgr
is collecting its backtesting data in the background while the Backtesting Optimization
is processing the data (designed to work currently with the TradeStation®)
8.X platform).
When the backtest process completes, BTWFMgr is automatically activated, and
will immediately convert and analyze and save the collected data, and then
present to you the results in several interactive graph,
so you can quickly identify the best results and apply the various functions to
analyze the results.
Step1 – Strategy Preparation & TradeStation® Optimization
In
the quick strategy preparation – we will add a small section at the end of your
strategy code,
which will perform the data collection in the background for you. BTWFMgr can
do this one time modification of your strategy automatically, so you do not
have to be an EasyLanguage expert!
(More
details below in the “Strategy Preparation” chapter)
Step2 – Detecting the optimal Strategy Potential/Parameters
The
only reason for your strategy to enter a new position (buy/short) at the
various entry points, is,
that you expect – on average – that the market will move in the anticipated
direction, allowing you to realize a profit. This assumption can now be
precisely tested and verified using BTWFMgr’s
powerful and innovative approach – detecting the best Trading
Strategy Potential.
Lets look at one example:
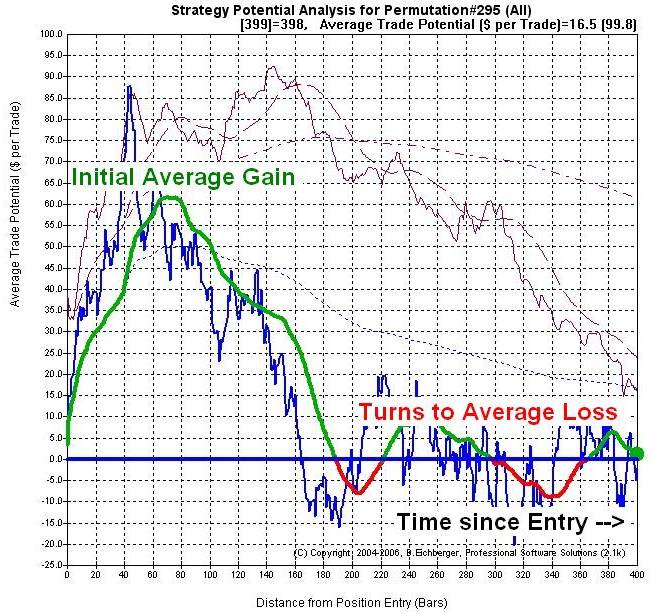
In this example the market moves initially in the
anticipated direction (green line) and reaches after 60 bars and average gain
of $60 (on each trade). Then the market moves – on average - against you.
The “Strategy Potential Graph” shows you clearly:
- How much maximum profit you can expect (highest point of green line)
- When that maximum profit is reached
- How the strategy potential develops over time and if the market turns against you.
- Calculates also a separate Potential for longs and shorts only
- Show the optimal ranges for each strategy input parameter
BTWFMgr is calculating – for each strategy input permutation – the most best and worst strategy potential excursion and then presenting you a list of the best results.
Step3 – Detecting the optimal Strategy Exit Method
Initially the optimal “Strategy Exit Logic” method is
not yet known, only the “Strategy Entry Logic”.
After we have identified the best strategy profit potentials, we can now detect
the best exit methods.
BTWFMgr come with an integrated “Position Exit Manager
(PEM)” which can evaluate 100,000 different exit method variations per
second, once all variations are tested BTWFMgr will then show you a list with
the best results. Then you can add the corresponding ”Strategy Exit Logic“
to your strategy.
In Potential Mode click on the OPT toolbar button and then initially create a
default Exit Definition:
Click on “Create Exit Definition”. You can then “Modify Exit Definition” or
directly “Run Exit Optimization”.
Step4 – Detecting the optimal Strategy Result
Now
with both the exit and entry logic - you are ready to re-run the TradeStation®
Optimization.
Set the nBTWFMGrExport strategy input parameter to 2 (Strategy Equity mode).
BTWFMgr will show you the best results
in several different lists:
·
Sorted by Max Equity
·
Sorted by Drawdown(%)
·
Sorted by PSSVolatility(%)
·
Sorted by Probability(%)
·
Sorted by ProfitFactor
·
Sorted by Smart Ranking1 – a custom
hybrid of above elements
·
Sorted by Smart Ranking2 – a custom
hybrid of above elements
·
Sorted by Smart Ranking3 – a custom
hybrid of above elements
BTWFMgr also shows you the optimal
ranges for each strategy input parameter and even
individual results for each specific strategy input parameter value!
Step5 – Walk Forward Analysis/Optimization (WFA)
In
this final step – to verify also using the powerful Walk Forward backtesting
method,
that your strategy has a realistic profit potential.
In many cases the curve fitted (fantastic) results in step4 are not likely to
repeat,
Which
leads usually to costly and discouraging trading results.
The new “Walk Forward backtesting method” can give you a much more
realistic preview and test of the true results your strategy can produce.
BTWFMgr
allows you to:
·
Use
any filter formula you devise
·
Use
any sort formula you want to test
·
Sort
all walk forward results identifying the best filter and sort method
·
Use
any in-sample and out-of-sample period setup
·
See
the out-of-sample results in one comprehensive equity graph or spreadsheet or
even 3D View
·
Show
the last period input parameter – which are then used in the actual live
trading
See
more information in a separate chapter “Walk Forward Analysis(WFA)” below.
Walk Forward Analysis (WFA)
BTWFMgr
contains also the advanced Walk Forward Analysis (WFA), which allows you
essentially to “fire-test” your strategy performance, using historical data,
and to find the most robust and predictive approach and parameters. Walk
Forward Analysis (WFA) is available in BTWFMgr Equity mode.
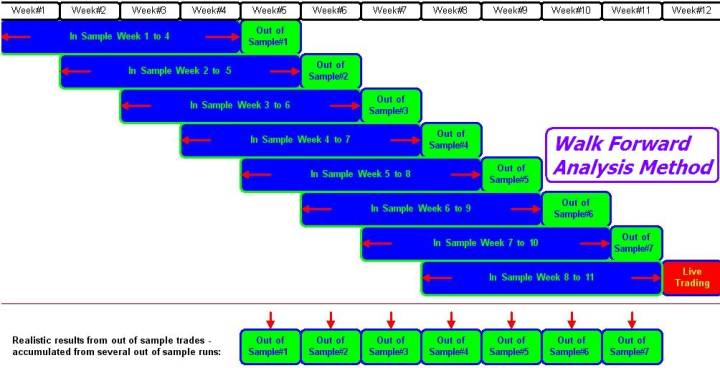
Walk Forward Analysis Overview
Walk
Forward Analysis (WFA) is a powerful automated process – saving you hours or
days of manual error-prone calculations. The following WFA steps are performed:
·
Identify
the customizable “In-Sample” period (blue section below)
·
Extract
all candidates from the “In-Sample” period using the WFA Filter and
eliminate all undesired results. In some case ALL candidates are eliminated.
·
Find
the “best” “In-Sample” permutation based on your WFA Sort specifications
·
Shift
the focus to the next customizable “Out-of-sample” period (green sections
below)
which follows directly the “In-Sample” period
·
Apply
this “best” permutation to the “Out-of-sample” period,
thereby “fire-testing” and checking if the “In-Sample” performance actually
continued.
·
Append
this “Out-of-sample” result to the overall WFA result.
·
Move
to the next “In-Sample” period until all data has been processed.
·
Show
the “best” strategy parameter for the future period (next “Out-of-sample”
period) (red below)
This WFA approach avoids the usual costly “curve-fitting” phenomenon, when a
stellar performance, does in many case NOT continue in the future live trading!
Below is an example using a 4 week “In-Sample” period and one week
“Out-of-sample” period
with 7 walk forward steps:
Below
is a BTWFMgr example of a 4 week “In-Sample” period and one week
“Out-of-sample” period:
(WFA Optimization#3 of the WalkFwd.btwf1 sample data set)
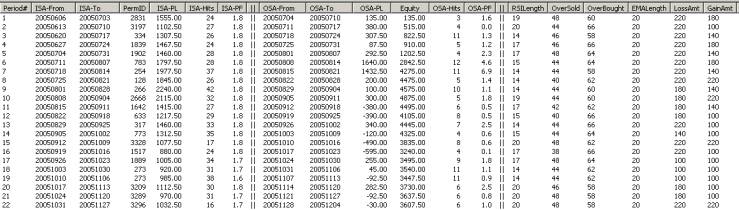
|
Column |
Example |
Description |
|
Period# |
1 |
Walk
Forward period, starting at 1 |
|
ISA-From |
20050606 |
“In-Sample”
starting date (Jun 6th, 2005) |
|
ISA-To |
20050703 |
“In-Sample”
ending date (Jul 3rd, 2005) |
|
PermID |
2831 |
“Best”
permutation ID for this ISA period |
|
ISA-PL |
$1555.00 |
Profit/Loss
within the “In-Sample” period (using PermID 2831) |
|
ISA-Hits |
24 |
Number
of positions the “In-Sample” period |
|
ISA-PF |
1.8 |
ProfitFactor
within the “In-Sample” period |
|
|
|
|
|
OSA-From |
20050704 |
“Out-of-Sample”
starting date (Jul 4th, 2005) |
|
OSA-To |
20050710 |
“Out-of-Sample”
ending date (Jul 10th, 2005) |
|
OSA-PL |
$135.00 |
“Out-of-Sample”
profit/loss within current period |
|
Equity |
$135.00 |
Overall
OSA equity total |
|
OSA-Hits |
3 |
Number
of positions the “Out-of-Sample” period |
|
OSA-PF |
1.6 |
ProfitFactor
within the “Out-of-Sample” period |
|
|
|
|
|
RSILength |
19 |
Strategy
Parameters representing the ”best” Permutation ID 2831 |
After the Walk Forward Analysis (WFA) you can then use the WFA Cluster Analysis
and 3D View to detect the best WFA trading parameters (more details below):

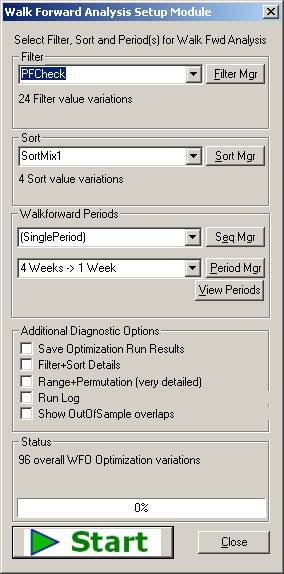
Walk Forward Analysis Setup Module
First
load the Equity result you would like to work with or click File/Open
WalkForward Sample File.
To activate the WFA Module:
·
click
on the ![]() (Optimize)
icon in the toolbar –or-
(Optimize)
icon in the toolbar –or-
·
Ctrl+R
–or-
·
select
from the menu: Functions/Run Optimization (Ctrl+R)
Follow
the simple steps below to run your Walk Forward Analysis(WFA) (explained in more details below):
·
Select/Define
your WFA Filter
·
Select/Define
your WFA Sort
·
Select/Define
your WFA Period Setup
·
Select
any “Additional Diagnostic Options” – usually all are unchecked for faster
performance
·
Click
on the ![]() button and confirm
button and confirm
·
Wait
for the WFA to complete – BTWFMgr shows you the overall and individual progress
in %
·
While
WFA is running you can click on the ![]() button to pause or
abort.
button to pause or
abort.
to continue the WFA press the ![]() button
button
·
When
WFA has completed BTWFMgr will prompt you and
display the new WFA result branch in the treeview.
Below you can see the Walk Forward Setup module:
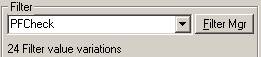
Walk Forward Analysis – Filter Definition (Step1)
The
first step in the Walk forward Analysis(WFA), is to eliminate unwanted candidates
from the complete list of all trade permutations within each “In-Sample” range.
This process is repeated for each WFA period.
Select the Filter to be used in the WFA from the list of Filters in the Walk
Forward Setup module:
With the “Filter
Manager” you can create and manage your own filter(s).
You
can also select “NoFilter” from the list – if you do NOT want to filter any
permutations.
Filter Manager
BTWFMgr
contains the easy “Filter Manager” interface– assisting you in creating/modifying
your WFA filters.
Simply click on the ![]() button in the Walk Forward
Setup module to activate the “Filter Manager:
button in the Walk Forward
Setup module to activate the “Filter Manager:
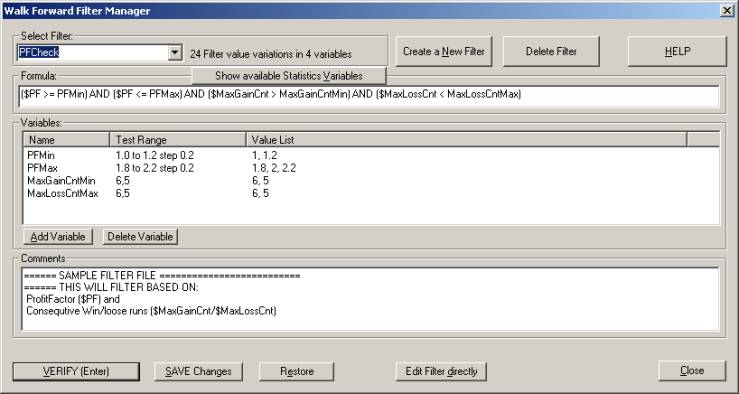
BTWFMgr
will show the number of filter variations next to the selected Filter:
”24 Filter variations in 4 variables”
which is the product of: 2xPFMin, 3xPFMax,2x MaxGainCntMin, 2x MaxLossCntMin.
Filter Formula
BTWFMgr
allows you to specify a formula, a simple logical expression, with a TRUE/FALSE
result.
TRUE=keep the permutation as a candidate, FALSE=discard the permutation in this
“In-Sample” range.
Below is a simple formula, which tests if the ProfitFactor ($PF) is at or above
1.0 (breakeven point):
($PF >= 1.0)
In
other words, we discard any permutations with a ProfitFactor below 1.0 (total
loss > total gains).
BTWFMgr
allows you even to go one step further and introduce “filter variables”, so you
can test several different filter variable values and determine which value(s)
yield the best overall results.
In the example below we replace the fixed “1.0” value with a new “PFMin”
variable (case sensitive):
($PF >= PFMin)
BTWFMgr allows you to define the values for “PFMin”:
PFMin=0.9 to 1.3 step 0.1
BTWFMgr
will run 5 tests with the following “PFMin” values:
0.9, 1.0, 1.1, 1.2, 1.3 (0.9 and 1.3 in 0.1 steps)
To see a list of available “Filter Statistics Variables” click on ![]()
or select from the list below:
Filter System Variables
Below
is a table of all system variables available for the Filter and Sort Formula:
|
$Equ |
Ending Equity |
|
$CntGain |
Number of Winning Trades |
|
$CntLoss |
Number of Losing Trades |
|
$CntTrd |
Number of all Trades |
|
$GrossGain |
Total of all Gains |
|
$GrossLoss |
Total of all Losses |
|
$AvgGainAmt |
Average Winner Amount |
|
$AvgLossAmt |
Average Loser Amount |
|
$MaxGainAmt |
Max Winner Amount |
|
$MaxLossAmt |
Max Loser Amount |
|
$MaxGainCnt |
Max Winner in a row |
|
$MaxLossCnt |
Max Losers in a row |
|
$PF |
ProfitFactor ($GrossGain / $GrossLoss) |
|
$PFAvg |
ProfitFactor ($AvgGainAmt / $AvgLossAmt) |
|
$Prob |
Probability(%)$CntGain/$CntTrd |
|
$MaxDDAmt |
Max Drawdown Amount (negative) |
|
$MaxDDPer |
Max Drawdown (% of Starting Capital) |
|
$DDAvg |
Drawdown average (% of ending Equiy) |
|
$StdDevAmt |
Standard Deviation Amount of all Trades
Profit/Losses Amounts |
|
$StdDevPer |
Standard Deviation (% of Starting
Capital) |
|
$VolatilityAmt |
Volatility
Amount = Avg distance$ from straight Income line |
|
$VolatilityNet |
Volatility
(% of Starting Capital) |
|
|
|
|
$RankEqu |
Equity Rank (100%=best/highest,
0%=worst/lowest) |
|
$RankMaxDD |
Drawdown Rank (100%=best/smallest,
0%=lowest/highest) |
|
$RankVolatility |
Volatility Rank (100%=best/smallest,
0%=lowest/highest) |
|
$RankProb |
Probability Rank (100%=best/highest,
0%=worst/lowest) |
|
$RankPFGross |
ProfitFactor ($PF) Rank
(100%=best/highest, 0%=worst/lowest) |
|
$RankCombo1 |
Smart Ranking Result1(%)
(100%=best/highest, 0%=worst/lowest) |
|
$RankCombo2 |
Smart Ranking Result2(%)
(100%=best/highest, 0%=worst/lowest) |
|
$RankCombo3 |
Smart Ranking Result3(%)
(100%=best/highest, 0%=worst/lowest) |
To
check the ranges and see actual values for each of these system variables,
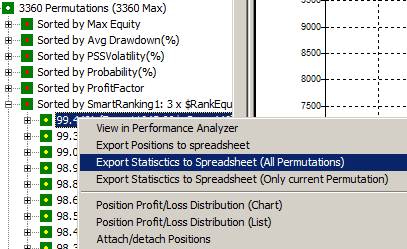
right click on any permutation
in the treeview and select “Export Statistics to Spreadsheet (All
Permutations)“.
Filter Math Functions
BTWFMgr
offers even the use of math functions in your WFA Filter formula, here is the
“PROM: filter formula:
(($AvgGainAmt*($CntGain-sqrt($CntGain)))/($AvgLossAmt*($CntLoss-sqrt($CntLoss))))>
PROMMin
Below is a table of available math function in the WFA Filter Formula:
|
abs(x) |
Absolute Value: abs(-5) = 5 |
|
foor(x) |
largest integer that is less than or
equal to x: floor(2.8)=2, floor(-2.8)=3 |
|
sqrt(x) |
Square root(x) |
|
sign(x) |
Sign: sign(-3)=-1, sign(0)=0, sign(6)=+1 |
|
exp(x) |
Exponential: exp( 2.302585 ) = 10.000000 |
|
pow(x,y) |
Power of: pow(2,3) =8.00000000 |
|
ln(x) |
Natural
logarithms: ln(9000) = 9.104980 |
|
log(x) |
Decimal
logarithms: log(9000) = 3.954243 |
|
log2(x) |
Binary logarithms : log2(4) = 2.000 |
|
sin(x) |
Sinus:
sin(1.570796) = 1.000000 |
|
cos(x) |
Cosinus: cos(1.570796) = 0.000000 |
|
cmple(x,y) |
Compare if less or equal: cmple(2,3)=1, cmple(2,2)=1, cmple(2,1)=0 |
|
cmplt(x,y) |
Compare if less: cmplt(2,3)=1, cmplt(2,2)=0,
cmplt(2,1)=0 |
|
cmpge(x,y) |
Compare if greater or equal:
cmpge(2,3)=0, cmple(2,2)=1, cmple(2,1)=1 |
|
cmpgt(x,y) |
Compare if greater: cmpgt(2,3)=0,
cmpgt(2,2)=0, cmple(2,1)=1 |
Creating a new Filter
To
create a new filter click on “Create a New Filter”:
·
Choose
if you want to clone the current filter or
create a blank new filter
·
Enter
the new formula
·
Click
on ![]() to see available
statistics variables.
to see available
statistics variables.
·
If
you are using variables - click on “Add Variable”
·
Enter
the new variable name
·
A
new variable with a single “0” value will be added
·
Click
on the “0” value in the “Test Range” column
·
BTWFMgr
will switch to edit cell mode
·
Enter
the new list of values, you have two formats available:
1.0 to 2.0 step 0.2 -or-
1, 1.3, 1.5, 2
·
When
you have added all variables and the formula click on “VERIFY”
·
Enter
any comment or description for the new filter
·
Correct
any errors
·
Finally
click on “SAVE” to actually save the new filter to the file
·
From
now on the new Filter will appear in the pull down menu.
·
If
you want to view the actual filter file content – click on “Edit Filter
directly”
Deleting an exiting Filter
Select
the filter to be deleted and click on “Delete Filter” – confirm the deleting.
Filter File Format
BTWFMgr
stores each WFA filter in a separate text file.
Here is an example of the “PFCheck:” filter file – located at
C:/BTWFMgr/PFCheck.btwff”:
Formula=($PF >= PFMin)
AND ($PF <= PFMax) AND ($MaxGainCnt > MaxGainCntMin) AND ($MaxLossCnt
< MaxLossCntMax)
PFMin=1.0 to 1.2
step 0.2
PFMax=1.8 to 2.2
step 0.2
MaxGainCntMin=6,5
MaxLossCntMax=6,5
;====== SAMPLE
FILTER FILE ==========================
;====== THIS
WILL FILTER BASED ON:
; ProfitFactor
($PF) and
; Consequtive
Win/lose runs ($MaxGainCnt/$MaxLossCnt)
The first line is always the Formula
Formula=($PF
>= PFMin) AND ($PF <= PFMax) AND ($MaxGainCnt > MaxGainCntMin) AND
($MaxLossCnt < MaxLossCntMax)
Then follow all the Filter Variables with their ranges
PFMin=1.0 to 1.2 step 0.2
PFMax=1.8 to 2.2
step 0.2
MaxGainCntMin=6,5
MaxLossCntMax=6,5
At the end is your description/comment – always starting with a semicolon:
;====== SAMPLE FILTER FILE
==========================
;====== THIS
WILL FILTER BASED ON:
; ProfitFactor
($PF) and
; Consequtive
Win/lose runs ($MaxGainCnt/$MaxLossCnt)
If
you are confident enough you could directly create and edit these filter file
(C:/BTWFMgr/*.btwff)
Walk Forward Analysis – Sort Definition (Step2)
After
the WFA has selected all viable candidates and discarded the rest in the Filter
Step1,
We
still have usually many candidates left.
In this WFA sorting step, BTWFMgr will re-arrange the candidates in a
customizable sort order.
The permutation/candidate showing up at the TOP is the ONE winner,
which is then used in for the “Out-of –sample” calculation.
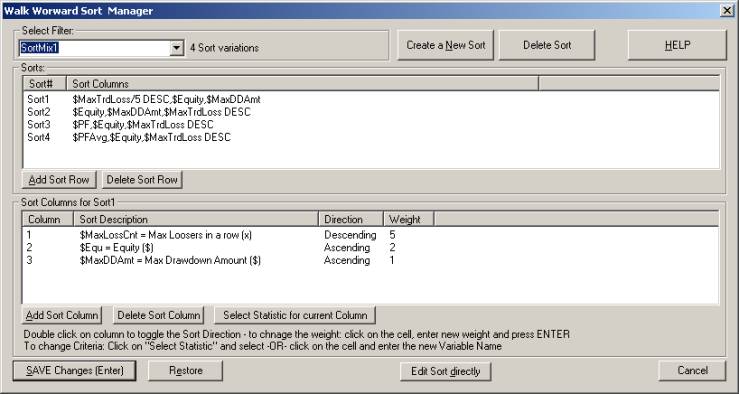
Each Sort Definition can contain one or several sort methods.
Below is an example of 4 different sorts:
Sort1=$MaxTrdLoss/5 DESC,$Equity,$MaxDDAmt
Sort2=$Equity,$MaxDDAmt,$MaxTrdLoss DESC
Sort3=$PF,$Equity,$MaxTrdLoss DESC
Sort4=$PFAvg,$Equity,$MaxTrdLoss DESC
Sort4=$PFAvg,$Equity,$MaxTrdLoss
DESC
Each WFA-Soft Definition is defined in a text file (Example
C:/BTWFMgr/SoftMix1.btwfs).
The “Walk Forward Sort Manager” is assisting you in managing and defining your
sort criterias:
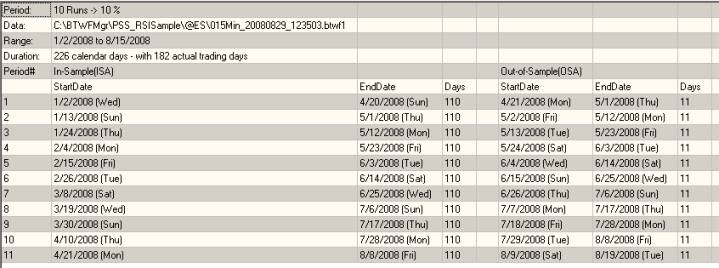
Walk Forward Analysis – Defining the Period Setup/Sequence
BTWFMgr
allows you several different ways to design the various in-sample(ISA) and
out-of sample(OSA) testing periods. BTWFMgr comes with many predefined period
setups,
but you can define and add any custom period setup!
To view the actual WFA period – click on ![]() (see examples below)
(see examples below)
You can even specify your own custom shift (in days) in the configuration:
Walk Forward Optimization/WFODayShift=0
a) Number of Walk Forward Runs and OSA Percent
You specify the number of Runs and the percent of out-of-sample days
Example: 10 Runs with 10% out-of-sample
b) Number of ISA/OSA Days
Example: 100 days ISA periods with 20 day out-of-sample periods
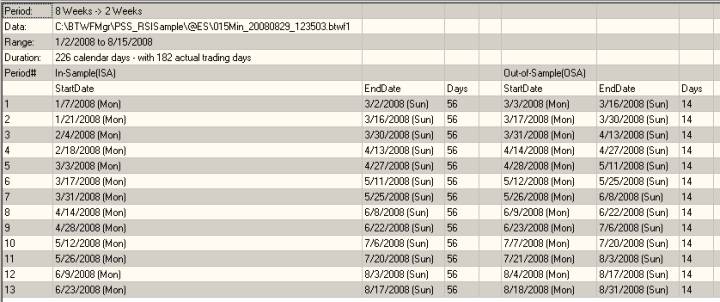
c)
Number of ISA/OSA Weeks
ISA periods always start on a Monday.
Example: 8 weeks ISA periods with 2 weeks out-of-sample periods
Defining a sequence of walk forward Period setups
BTWFMgr
allows you even to select a sequence of period setups,
so you can test which period setup performs the best for your strategies!
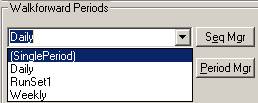
You can either select one of the predefined Period Sequences (Daily, Weekly
etc) –or-
design your own – press the “Seq Mgr” button – and the ”Walk Forward Period
Sequence Manager” will open!
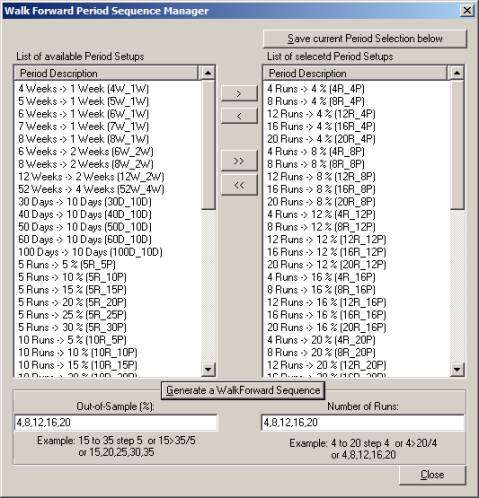
The following functions are available:
a) Single Add: click one period on left – then click the Add button ![]()
b) Group Add: click
your selection on the left – then click the Add button ![]()
c)
All Add: click on the Add All button ![]()
d) Generate custom Sequence: enter the “Out-of-Sample(%)” and “Nbr of Runs”
list;
then click the “Generate a Walk Forward Sequence”
e)
Single Delete: click one period on right– then click the Delete button ![]()
f) All Delete: click
on the Delete All button ![]()
Remember to save any
newly created Period selection – press the Save putton:
![]() - then enter the new Period
Sequence Name.
- then enter the new Period
Sequence Name.
Walk Forward Analysis – Check your Save Result Options
Usually
all check boxes in the “Additional Diagnostic Options” section are left
unchecked
to achieved maximum speed for the Walk Forward Analysis:
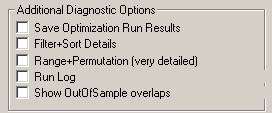
In some cases you might want to review and track internal WFA calculations and
enable some diagnostic options, which are also saved to the new WFA sub folder.
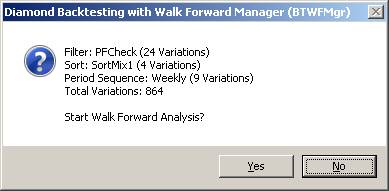
Walk Forward Analysis – Starting Walk Forward Analysis
To
finally start the Walk Forward Analysis (WFA) – simply press the green “Start
Run” button:
![]()
And
confirm the new Walk Forward Analysis Run:
You can now abort or pause the WFA run by pressing the ![]() button.
button.
A
box appears were you can choose:
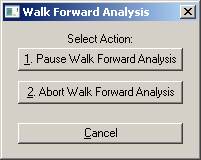
As
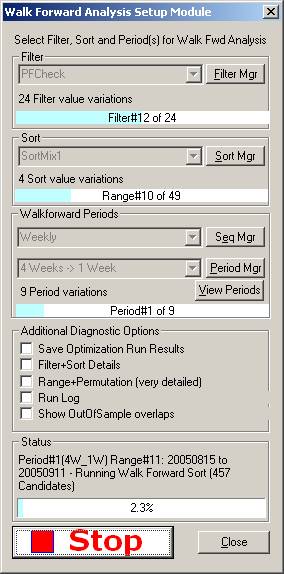
BTWFMgr calculates the many WFA permutations - the progress is shown to you in
the cyan bars
For
each level:
·
Filter
(current filter processed with in the current Date Range)
·
Range
(current Date Range within the current period)
Each period definition creates several date ranges for the
In-Sample/Out-of-Sample periods.
Click on “View Periods” to see the date ranges being created for the WFA
·
Period
(current Period as defined in the Period Sequence, unless a single period has
been selected)
·
Overall
progress at the button
Example
of running WFA:
Walk Forward Analysis – Treeview Display
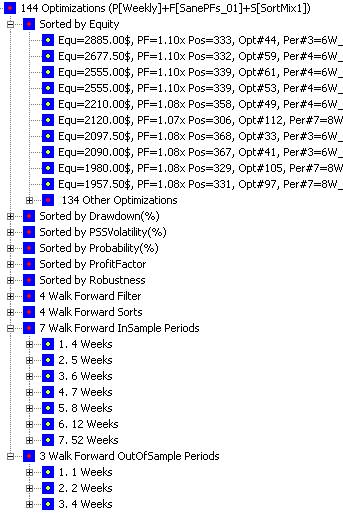
When
the WFA has completed, BTWFMgr automatically add a new tree branch, with blue
squares, at the top.
The
WFA results are shown first sorted by 6 different criteria (Equity, Drawdown,
Volatility, Probability, ProfitFactor and Robustness). Then follow the Filter
and Sort Variations used in this WFA and the In/OutSample periods calculated –
Below is an example:
Walk Forward Analysis – Result Viewing
BTWFMgr
offers many ways to view the WFA results and identify the best WFA logic:
View best WFA Equity
BTWFMgr
is showing by default the top 10 WFA results, just click on any of the results
to view the equity.
The remaining results are shown in the “XXX Other Optimizations” branch.
If you want to see more than 10 top results – changed the configuration
parameter “MaxWFOOpt”.
View best WFA Probability
Click
on the (+) in front of the “Sorted by Probability” branch and BTWFMgr will
expand the branch
and show the list of the top 10 results:
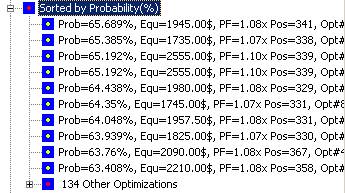
If
you want to see more than 10 top results – changed the configuration parameter
“MaxWFOOpt”
View best WFA Drawdown, Volatility, ProfitFactor and Robustness
Click
on the (+) in front of the “Sorted by XXX” branch and BTWFMgr will expand the
branch
and show the list of the top 10 results – similar to Equity and Probability.
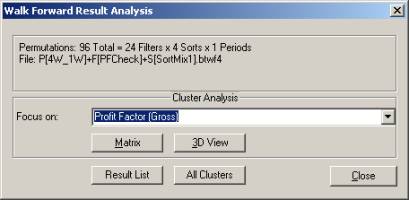
WFA 3D Cluster View
Right
click on any WFA results and you will see the WFA popup menu – then click on
”Walk Forward Result-Cluster Analysis” (or press Ctrl+A) or from the Menu
Function/Cluster Analysis:
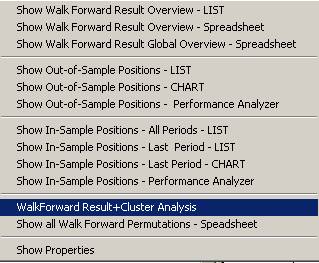
The Walk Forward Result+Cluster analysis box will appear:
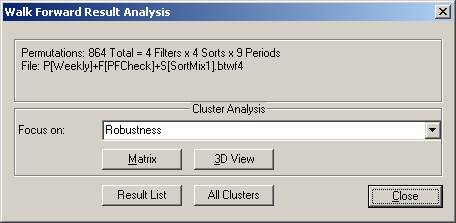
Select
the criteria you would like to view (i.e. Net PL$) and click on “3D View”.
Now
you can choose if you want to plot the Filter and Sort variations –OR- In/OutSample
variations:
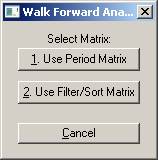
The
“Filter/Sort Matrix” will use the Filter and Sort variations for the X and Z axis.
The
“Period Matrix” will use the In/OutSample variations for the X and Z axis.
The
Y Axis is defined by your selected criteria abive.
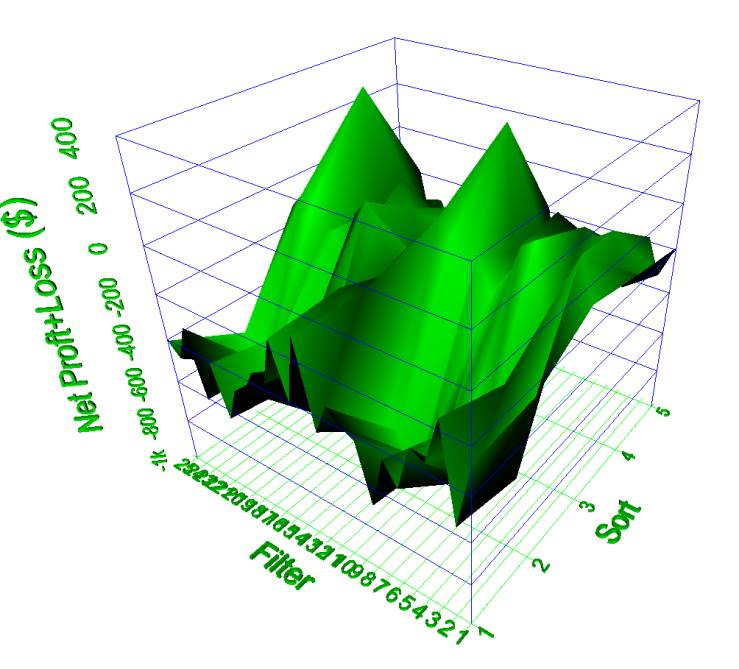
Below
is an 3D WFA Result example, showing:
·
X
Axis: 4 sort variations plus the 5th Sort Average results
·
Z
Axis: 24 filter variations plus the 25th Sort Average results
·
Y
Axis: The Net Profit+Loss($) (or whichever criteria you selected)
Navigating the 3D View
·
To
Zoom in – rotate the mouse wheel away from you
·
To
Zoom out– rotate the mouse wheel towards you
·
To
Rotate to the left – click and hold left mouse button and move slowly to the
right
·
To
Rotate to the right– click and hold left mouse button and move slowly to the
left
·
To
Rotate to the top– click and hold left mouse button and move slowly down
·
To
Rotate to the bottom– click and hold left mouse button and move slowly up
·
To
move the center – click on hold the right mouse button and move in the desired
direction
·
To
capture/print the view – click on the print button in the toolbar
WFA Processing Details
Here
we give you a more detailed look at the actual steps the WalkForwardAnalysis
(WFA) process.
WFA will first create a new folder were all results are saved with the input
filename:
Example: Results for Input file:
“C:\BTWFMgr\PSS_RSISample\@ES\015Min_20080829_123503.btwf1”
are all saved to folder “C:\BTWFMgr\PSS_RSISample\@ES\015Min_20080829_123503”
The general WFAVerbose level determines the processing diagnostic details
level;
Which
all off for highest WFA Speed!
The
following abbreviations are used:
WFA=Walk Forward Analysis, ISA=In Sample Range, OSA=Out of Sample Range
The
following steps occur when for each WFA process:
·
Main1:
Load the period sequence definitions (from selected *.btwfl file, i.e.
Daily.btwfl)
·
Main2:
Check if for each period sequence definition enough data is present
·
Main3:
Create a matrix for each filter/sort and period variation
o Period1: Load next period
sequence definition (i.e. 10 Runs OSA 5%)
o Period2: Create the
In/OutSample date ranges – as shown in “View Periods” function
(i.e. create 10 date ranges for current data an OSA portion of 5%)
o Period3: Process the
first/next period definition
§ Range1: Process first/net
date range - create the subfolder for results:
Example: P001[30D_10D]+F[PFCheckTest]+S[SortMix1] = {PeriodFolder}
§ Calculate the statistics for
each Trade Permutation in the current ISA date range
§ Range2: Calculate the
relative ranking values
§ Range3: If requested
(SaveTrdPerm switch) export the statistics of each Trade Permutation to
the range result file in a sub folder for this period def, Example:
{PeriodFolder}/TradePermutations/ Rng0001_20080109_20080207.csv
§ Range4: Calculate the
specified filter condition to pass/fail each trade permutation
§ Range5: Sort the remaining
filtered candidates (unless ALL permutations filtered out)
§ Range6: If requested
(SaveOptPerm switch) exports the
{PeriodFolder}/Hits/OPT0000001_P001_F0001_S0001_20080109.csv
§ Range6: Establish the final
trade permutation ID
§ Range7: If requested
(SaveRunLog switch) exports the best result to:
{PeriodFolder}/Rng0001_20080109_20080207.csv
§ Repeat Range1-Range7 for all
remaining date ranges for this period
o Period4: Accumulate the OSA
Results and calculate the OSA statistics
o Period5: If requested
(SaveRunLog switch) exports the best result to:
{PeriodFolder}/ OPT0000008_P001_F0002_S0004.csv
o Repeat Period1- Period5 for
all remaining Period Definitions
·
Main4:
Save all WFA calculations to a binary file (*.btwf4)
·
Main5:
Post Process overall WFA Results
·
ll results are saved in a newly created folder – using the filename – Example:
WFA Results for: C:\BTWFMgr\PSS_RSISample\@ES\015Min_20080829_123503.btwf1
will be saved in new folder: “C:\BTWFMgr\PSS_RSISample\@ES\015Min_20080829_123503”
Within that folder the following sub folder are generated:
TradePermutations\P001_XXX – Results for Period Sequence #1
TradePermutations\P001_XXX\R0001_20080109_20080207_0000084Permutations.csv -
R0001=Range#1, 20080109=ISA Start Date, 20080207=ISA End Date
P[30D_10D]+F[PFCheckTest]+S[SortMix1] – WFA Results for:
Period “30D_10D” Filter “PFCheckTest” and Sort “SortMix1”
”SaveOptPerm” switch:
P[30D_10D]+F[PFCheckTest]+S[SortMix1]\Hits – WFA Filter Results
P[30D_10D]+F[PFCheckTest]+S[SortMix1]\Hits\SEQ0000001_P001_F0001_S0001_20080208.csv
SEQ0000001=Overall Sequence, P001=Period#1, F0001=Filter#1, S0001=Sort#1
20080208=ISA Start
”SaveRunLog” switch:
SaveRunLog
BTWFMgr Functions Reference
In
this section we illustrate in more detail how to use the various powerful
BTWFMgr functions.
Some functions might only apply only to Equity Mode (Equ) and/or Potential Mode
(Pot)
Long/Short Splitting (Equ)
 After
you run an optimization, the results contains usually long and short trades in
the many permutations. BTWFMgr will detect the overall best Equity, Drawdown
etc using long and short
After
you run an optimization, the results contains usually long and short trades in
the many permutations. BTWFMgr will detect the overall best Equity, Drawdown
etc using long and short
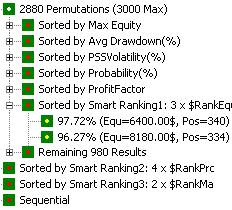
and show them in the “Sort by XXX” green square branches:
In many cases you might need to split the long and short results into separate
files,
 Thereby creating their own
Backtesting context with new “Sorted by XXX” lists!
Thereby creating their own
Backtesting context with new “Sorted by XXX” lists!
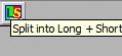
You
can do the L/S Split
 by simply clicking on the LS
icon in the toolbar:
by simply clicking on the LS
icon in the toolbar:
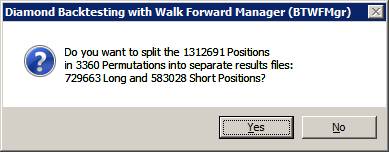
Next BTWFMgr will confirm
click
YES to continue:
Next BTWFMgr will proceed to generate
two new BTWFMgr result files,
And when finished, give you the option
to view the new “Long Only” (WalkFwd-L) result:
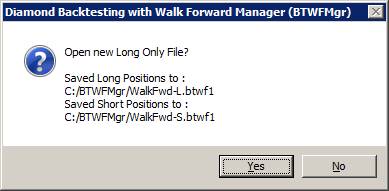
To view the “Short only” result – click on the new C:\BTWFMgr\WalkFwd-S.btwf1
file.
Equity Curve Cutoff (Equ)
BTWFMgr
(as most other software tools) sort all results by the ENDING Equity,
Which
is considered the best performance.
But
as you might have noticed, many times the best performance, is not always
continuing that previous performance – below is an example how a stellar
performance:
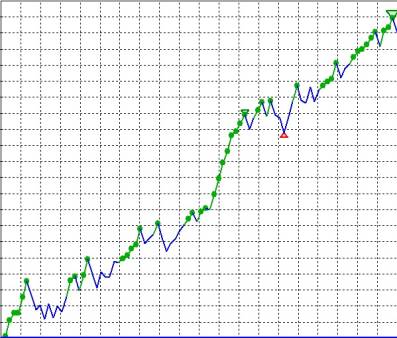
can
turn into a big drawdown
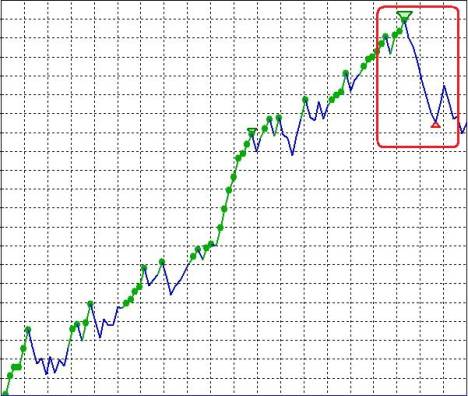
With
BTWFMgr you can now to double-check and research this phenomenon using your own
results.
Just define an earlier reference point within the equity curve – which is used
to sort the results,
instead of the usual 100% ENDING equity point.
In effect you virtually “cut off” a portion of last trades – just for the
sorting, the data Is not really lost.
(This
“cutoff” function only applies to the Equity Mode)
Simply click on the Recaclulate Icon:
![]()
Then
enter the new point of reference (instead of the usual 100% at the end):
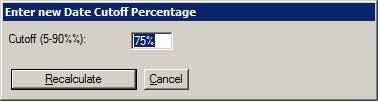
To
start the conversion click “Recalculate”.
The new equity curves will show a new magenta line; connecting the cutoff point
with the ending result:
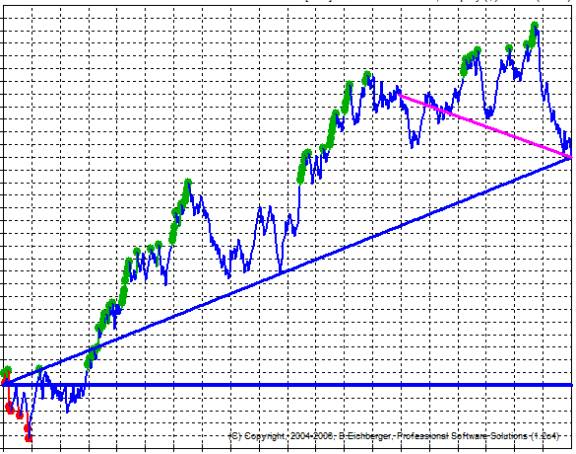
Click
on any performance result and you can easily check visually –
if
the previous performance actually continued.
This is similar to the the “In-Sample” and “OutSample” segments used in the Walk
Forward Analysis(WFA),
If the Equity results are using an early “cutoff” point
BTWFMgr will show the cutoff percentage in the header:
![]()
Export Statistics (Equ)
In
some cases you might want to use a custom spreadsheet, to identify and analyze
the backtesting trade permutations. BTWFmgr allows you to export all the
relevant statistical values for each permutation (or just the current one) to a
spreadsheet.
Simply right click on the permutation and select “Export Statistics”:
BTWFMgr
will generate
a new spreadsheet file for the current file – with StatsALL appended -
and ask you if you would like to view the new spreadsheet file (CSV format):
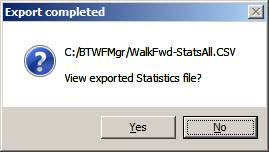
Click YES to see the
new spreadsheet, were you can now apply your custom analysis/sort etc:
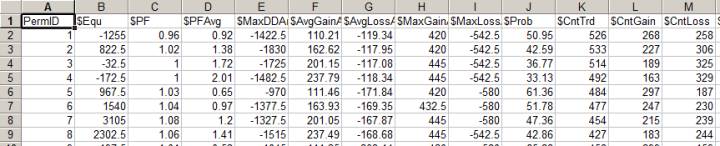
This Statistic Export can also assist you in designing custom WFA filter
formulas!
Instead of all permutations you can also select the single export –for just the
current permutation.
Strategy Preparation
In order for BTWFMgr to analyze your strategy – BTWFMgr has to collect the
relevant data generated during your TradeStation®
Optimization runs.
To accomplish this BTWFMgr adds a small
section to the end of your EasyLanguage® strategy code.
Preparing TradeStation® - Opening your Strategy Code
Before BTWFMgr can automatically add the data collection section – open the strategy code:
·
Open TradeStation®:
Start/Programs/TradeStation 8.1 (Build XXX)
·
Close all workspaces
·
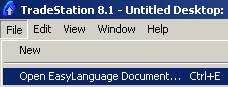
Open the strategy EasyLanguage Code
File/Open EasyLanguage Document (or Ctrl+E)
·
Select "Strategy" in the
Select Analysis type pull down list (at the top)
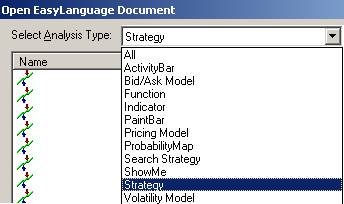
·
In the new list scroll down to your
Strategy and click the Strategy Name
then click on the Open button (as an example we use the PSS_T_Sample1 strategy
here …)
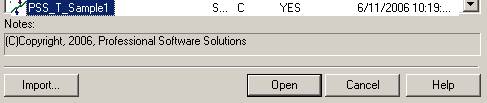
·
You might need to enter a protective
password to open the Strategy Code
·
A new Strategy EasyLanguage window has
opened:
![]()
Now we have
prepared TradeStation® for BTWFMgr to automatically modify your strategy.
Adding the BTWFMgr Data Collection Section
·
Open BTWFMgr:
Start/Programs/Diamond Backtesting with Walk Forward Manager
(BTWFMgr)/Backtesting with Walk Forward Manager (BTWFMgr)
·
Once BTWFMgr has opened – click on the
cyan exclamation mark ![]() in
the tool bar:
in
the tool bar:
![]()
(or select File/Strategy Preparation from the Main Menu)
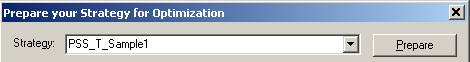
·
A new window will open – showing your
strategy name – click on Prepare:
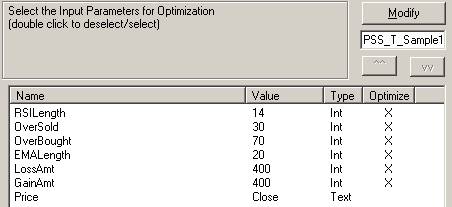
·
BTWFMgr is now presenting you with all
numeric strategy input parameter,
which can be included in the data collection during the TradeStation®
optimization:
(indicated by the X in the Optimization column)
Select ALL inputs you might use in any TradeStation® optimization (usually
all).
Just double click on the input row and BTWFMgr will select/deselect it.
·
You can change the sequence of an input
with the up ![]() and down
and down ![]() button
button
·
Now click on the modify button to let
BTWFMgr add the new data collection section
![]()
·
Now BTWFMgr will automatically modify
the strategy code for you and
after a few seconds show the confirmation box – click on OK:
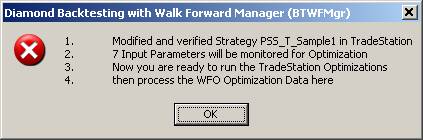
·
Now you are ready to run the regular
TradeStation® Optimization on your strategy,
which will now collect the relevant data for you, so you can then analyze it in
BTWFMgr.
The initial Strategy Potential mode (nBTWFMgrExport=1) is automatically
pre-selected for you.
Below is a sample of the BTWFMgr data collection section.
Adding Context Variables
When you develop your strategy, you
usually want to research also the effect of additional context input values on
the overall results. With BTWFMgr you can now check if certain ranges or values
will improve the overall strategy results and by filtering out bad entries.
BTWFMgr adds for you automatically already the TimeOfDay context value.
Example:
Research of a certain range of the moving average angles might be connected to
better results.
Below are the steps to add an additional context variable:
·
Add Context Variable Name
Add one line for each new context variable after the line
WalkForwardVar = WalkForwardVar + "/*TimeOfDay";
Here is one example - adding an angle:
WalkForwardVar = WalkForwardVar + "/ExpAngle";
(the * indicates the first context variable name):
·
Increase Argument Counter
Increase the input counter by the number of newly added context values,
below the line:
arrPSSBTVal[0] = 6; // Number of tracked Strategy Inputs
if nBTWFMgrExport = 1 OR (nBTWFMgrExport = 3 AND CurrentShares = 1818) then
arrPSSBTVal[0] = 7; // add Number of
Context Variables
In our example: we increase by one - from 7 to 8
·
Add Context Variables to
Function Call
Add the actual context values to the BTWFMgr data capture function argument
list, after the line:
arrPSSBTInp[6] = Time; // Context Input#01
Here is one example - adding an angle:
arrPSSBTInp[7] = AnglePercent; // Context Input#02
·
Verify the EasyLanguage
After modifying he strategy code verify the EasyLanguage code (Tools/Verify)
·
Re-Run TradeStation®
optimization
Now you can re-run the TradeStation® Optimization,
which will now collect also the data at each entry also the added context
variable values.
More information at: http://www.profsoftware.com/bt/eldmode.htm
BTWFMgr will show the result for each context variable in the "Context
Variables" section.
Sample of Data Collection Section
Below is a sample of the BTWFMgr data
collection section – with the two added context variables:
Time, // Context Input#01
AnglePercent, // Context Input#02
//====== BTWFMGR_F2D83D3A_BBDB_447E_B0FE_209ED95E4E3F
=============
//====== WALK-FORMWARD-OPTIMIZATION DATA COLLECTION
SECTION ======
Vars: nRetWFO(0),WalkForwardVar("");
if nBTWFMgrExport > 0 then begin
if GetAppInfo(aiOptimizing) = 1 then begin
if
WalkForwardVar = "" then begin
WalkForwardVar
= "RSILength";
WalkForwardVar = WalkForwardVar + "/OverSold";
WalkForwardVar = WalkForwardVar + "/OverBought";
WalkForwardVar = WalkForwardVar + "/EMALength";
WalkForwardVar = WalkForwardVar + "/LossAmt";
WalkForwardVar = WalkForwardVar +
"/GainAmt";
if
nBTWFMgrExport = 1 then begin
WalkForwardVar = WalkForwardVar + "/*TimeOfDay";
WalkForwardVar = WalkForwardVar + "/ExpAngle";
end;
end;
if
nBTWFMgrExport = 2 then begin
nRetWFO = PSS_F_WFO10("PSS_T_Sample1", //Strategy
WalkForwardVar,
// Names of Inputs
6,
// each selected Input Variable below
RSILength, // Strategy Input#01
OverSold,
// Strategy Input#02
OverBought,
// Strategy Input#03
EMALength,
// Strategy Input#04
LossAmt, // Strategy
Input#05
GainAmt
// Strategy Input#06
,0,0,0,0);
end;
if
nBTWFMgrExport = 1 then begin
nRetWFO = PSS_F_WFO10("PSS_T_Sample1", //Strategy
WalkForwardVar, // Names of Inputs
-8,
// each selected Input Variable below
RSILength,
// Strategy Input#01
OverSold, // Strategy Input#02
OverBought,
// Strategy Input#03
EMALength,
// Strategy Input#04
LossAmt,
// Strategy Input#05
GainAmt, // Strategy
Input#06
Time,
// Context Input#01
AnglePercent, // Context Input#02
0,0);
end;
end;
If
nBTWFMgrExport = 1 then begin
If
marketposition = 1 then
Sell ("Lbt") next bar Market;
If
marketposition = -1 then
Buy to Cover ("Sbt") next bar Market;
end;
end;
//======
BTWFMGR_F2D83D3A_BBDB_447E_B0FE_209ED95E4E3F =============
Detecting the optimal Strategy Potential/Parameters
After
you have prepared your strategy and the TradeStation Optimization has
completed,
BTWFMgr will automatically starts and perform automatically the initial data
conversion and then
present to you the Strategy Potential Analysis. (make sure you have
nBTWFMGrExport set to 1).
Analyzing the Strategy Per Trade Potential
Analyzing
the Strategy Per Trade Potential
Analyzing the Strategy Yearly Potential
Analyzing
the Strategy Yearly Potential
Analyzing the Strategy Parameter Potentials
Analyzing
the Strategy Parameter Potentials
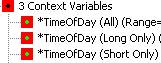
Analyzing the Strategy Context Variables
Analyzing
the Strategy Context Variables
(under
construction …)
·
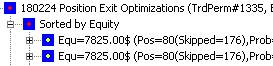
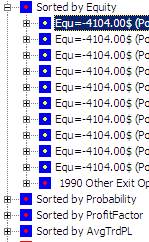
Exit Optimization Results
Showing the top 10 results - sorted by the best average return per trade:
![]()
·
The remaining results are collected behind the “Other Exit
Optimizations” item:
![]()
How many exit optimizations are shown is defined in
the “MaxExitResults” configuration parameter (2000) in the TreeView section.
·
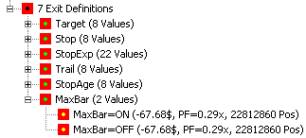
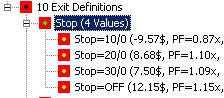
Exit Parameter Analysis
Showing for each exit parameter the individual results
Detecting the optimal Strategy Exit Method
After
you have identified the best Strategy Potential for Long and Short trades,
you can now let the “Position Exit Manager (PEM)” calculate many
different exit scenarios,
 so you can identify the best
“Strategy Exit Logic”.
so you can identify the best
“Strategy Exit Logic”.
Usually Longs and Shorts have different optimal exit parameters.
Since the integrated “Position Exit Manager (PEM)” is using fast object
oriented C++ code,
it can process 100,000 exit variations per second (~1000 time faster than the
regular backtesting)!
First click on the result with the best potential, which actualizes the
permutation ID.
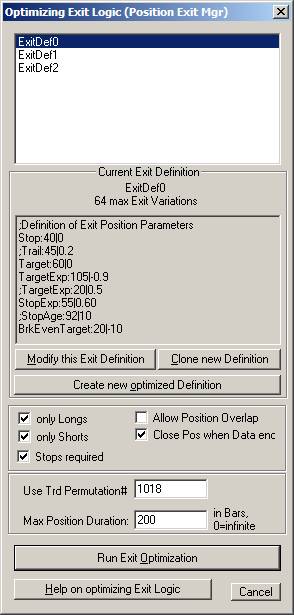
Then Click on the ![]() button in the
toolbar, which brings up the Optimization box:
button in the
toolbar, which brings up the Optimization box:
The current permutation ID (1018) is shown in:
![]()
which
determines all the positions to be tested.
Then
click on ![]() to create a new
default template tailored to the current potential.
to create a new
default template tailored to the current potential.
This will create a new exit definition:
![]()
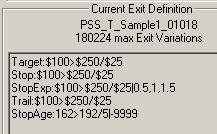
Each line defines a type of exit with a testing range
(see details about exit types below).
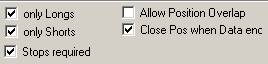
You can select various processing parameters:
Finally you start the processing – click on:
![]()
Which
will process the 180,224 exit permutations
for each of the 579 positions in Trade Perm ID 1018
![]()
In
only a few minutes all 88.4 million scenarios are completed:
![]()
![]()
Analyzing the Strategy Exit Results
After
the optimization is complete a new exit result branch will appear in the
treeview:
Analyzing the Strategy Exit Parameters
Analyzing
the Strategy Per Trade Potential
BTWFMgr Configuration and Preferences
BTWFMgr
allows you to easily change and almost all of its internal parameters,
so you can tailor the behavior to your needs.
To start the configuration, simply click on the ![]() icon in the toolbar –or- Ctrl+C
–or-
icon in the toolbar –or- Ctrl+C
–or-
select or from the in the Menu: File/Backtesting Configuration and Preferences
(Ctrl+C)
All parameters are organized by topics:
·
TreeView
·
Smart Ranking Analysis
·
Best Trade Permutation Analysis
·
Walk Forward Optimization
·
Strategy Potential & Probability
Analysis
·
Initial Data Conversion
·
Position Exit Manager (PEM)
·
General
·
Chart
Below
each topic the associated parameters are attached. You can expand and collapse
each topic,
by clicking on the plus or minus mark (![]() and
and ![]() )
in front of the topic.
)
in front of the topic.
To
see a more detailed description - click on the parameter,
and the right window section will show the description and current setting -
You can now:
·
Change the parameter value (simply
enter/select the new value and click on “Apply”)
·
Restore to the previous setting – after
an erroneous change for example – click on “Restore”
·
Switch to the parameter default value –
click on “Default”
Close
the Configuration Window via the “Close” button, the ESC key or the ![]() window button.
window button.
The
new parameter settings is shown with a star and activated next time you open
BTWFMgr again.
A detailed description of each parameter section is presented below.
Below is a sample screen of the BTWFMgr Configuration and Preference WindowBelow is a list of all the available BTWFMgr Configuration settings you
can adjust to your needs.

(You can also edit the configuration parameters directly in the C:/BTWFMgr/BTWFMgr.ini
file)
TreeView Settings
In this section you can
adjust settings related to the BTWFMgr treeview window:
|
Name |
Default |
Description |
|
AttachInputs |
YES |
|
|
AttachPermToSubInput |
NO |
Attach automatically all
relevant Trade Permutations to each Sub Input variation. You can of cause
still attach/detach the permutations manually, NO is recommended for large
Permutation sets (30,000+) |
|
AttachSubInputsMaxPerm |
10000 |
Maximum number of Trade
permutations before the automatic attachment of Trade Permutations to inputs
is turned off |
|
AttachSeqTrdPerm |
YES |
Automatically attach ALL
Trade Permutations in Sequential order after the Best Results display |
|
AttachPosSeq |
NO |
Automatically attach the
positions to each Trade Permutation in the Sequential Permutation List.
Warning: YES can consume a lot of memory with large Permutation sets (30000+) |
|
MaxExitResults |
2000 |
Maximum number of Position
Exit(PEM) Results shown in the TreeView or potential results |
|
EquTimeLength |
30 |
Define the time length for
automatic Time of Day Analysis |
|
TreeWidth |
360 |
Define the default width
in pixels of the treeview window (360=default) |
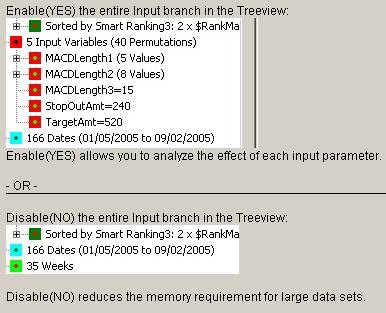
Smart Ranking Analysis Settings
In this section you can
adjust settings related to the BTWFMgr Smart Ranking Analysis:
|
Name |
Default |
Description |
|
EquRankDef1 |
3x$RankEqu, |
Define the Equity Smart
Ranking#1 Analysis formula |
|
EquRankDef2 |
4x$RankProb |
Define the Equity Smart
Ranking#2 Analysis formula |
|
EquRankDef3 |
2x$RankMaxDD |
Define the Equity Smart
Ranking#3 Analysis formula |
|
MinEquityPercent |
20.0 |
Cutoff percentage in the
Equity Ranking for the Smart Ranking Candidates |
|
PFMin |
0.2 |
Define the minimum
ProfitFactor(PF) used the filter out Trade Permutation results for the Smart
Ranking Analysis |
|
PFMax |
4.0 |
Define the maximum
ProfitFactor(PF) used the filter out Trade Permutation results for the Smart
Ranking Analysis |
|
PotRankDef1 |
2x$RankAvg |
Define the Potential Smart
Ranking#1 Analysis formula |
|
PotRankDef2 |
2x$RankYrAvg |
Define the Potential Smart
Ranking#2 Analysis formula |
|
PotRankDef3 |
1x$RankAvg |
Define the Potential Smart
Ranking#3 Analysis formula |
Best Trade Permutation Analysis Settings
In this section you can
adjust settings related to the BTWFMgr Best Trade Permutation Analysis:
|
Name |
Default |
Description |
|
CalcBestTrdPerm |
YES |
Enable or disable Best
& Smart Trade Result display |
|
SkipLoosers |
NO |
Skip loosing Equity
Permutations (Default=include them) |
|
CacheBestTrdPerm |
YES |
Enable or disable Best
Trade Result caching to speedup the load |
|
AttachBestPos |
NO |
Automatically attach the
positions to each Trade Permutation in the Best Result display. Warning: YES
can consume a lot of memory with large Permutation sets (30000+) |
|
MaxPermBest |
20 |
Number of Trade
Permutations shown in the Best Result List |
|
MaxPermBest2 |
1000 |
Total number of Trade
Permutations shown in the remaining Best Result section |
|
MaxPermBestExport |
100 |
Total number of exported
best Trade Permutations to CSV Spreadsheet file for the BTWFMgr Overview
module |
|
MakeBestUnique |
YES |
Eliminate Duplicate
Results (YES) in the Best Trade Result display |
|
CompareMaxDiffMinutes |
30 |
When Comparing Position
Lists define the\nmaximum Number of entry time differences (in Minutes) |
Walk Forward Analysis+Optimization Settings
In this section you can
adjust settings related to the BTWFMgr Walk Forward Optimization and Analysis:
|
Name |
Default |
Description |
|
MaxWFOOpt |
10 |
Maximum number of Walk
Forward Optimizations to show directly in the Treeview. The remaining results
are shown in the Other results branch |
|
OSAStyle |
0 |
Define how Walk Forward
Out Of Sample Positions are handled which cross/overlap across the begin or
end of the OSA Period: |
|
OSAStyleVerbose |
YES |
Switch OSA Overlap Check
verbose mode ON/OFF |
|
SaveRunSet |
NO |
Save each Walk Forward
Period Result |
|
SaveTrdPerm |
NO |
Save the Trade
Permutations of each Walk Forward Period |
|
SaveOptPerm |
NO |
Save the each filtered
Trade Permutations of each Walk Forward Period |
|
SaveRunLog |
NO |
Total number of exported
best Trade Permutations to CSV Spreadsheet file for the BTWFMgr Overview
module |
|
WFODayShift |
0 |
Number of Days to shift
from the calculated default dates: |
|
WFOAddPeriod |
1 |
Number of periods to
append without historical data |
|
AUTOSTART |
1 |
Enable the automatic
conversion of backtesting data |
|
AUTOEXIT |
0 |
Enable the automatic exit
after conversions (set to 1) |
|
AUTOWFO |
0 |
Enable the automatic
WalkForward Optimization with the last used WFA parameters after the data is
converted/loaded (set to 1) |
Strategy Potential & Probability Analysis Settings
In this section you can
adjust settings related to the BTWFMgr Potential Analysis:
|
Name |
Default |
Description |
|
CommissionAndSlippage |
15.00$ |
Set the amount of the
commission (incl. slippage) per position to get more realistic results |
|
PotentialMaxLoss |
400$ |
Define the maximum loss
during potential scanning |
|
RRScope |
200 |
Define the maximum scope
(number of bars) available for the Strategy Potential analysis |
|
RREOD |
0 |
Define the End of Day Exit
Time for Intraday strategies to avoid holding overnight (0= no exit,
1615=4:15PM) |
|
RREOW |
0 |
Define the End of Week
Exit Time for Intraday strategies to avoid holding over a Weekend |
|
RRNetPotential |
YES |
Use Net Best Potential
(Best minus worst potential up to that point) |
|
RRMinPos |
20 |
Minimum number of
Positions required for a Trade Permutation in order to qualify for the Best
Trade Result display |
|
RRMinDistPos |
10 |
If positions entries are
too close - skip during Strategy Potential calculations - minimum distance is
defined here |
|
MinRRCnt |
8 |
Minimum number of Position
samples needed for Result display |
|
RRAvgPer |
10 |
Number of bars used for
the Strategy Potential Average calculation |
|
RRPercentFactor |
100 |
Factor to magnify the
Percent display in the Y Scale in the Strategy Potential Chart |
|
MaxContextVariations |
15 |
Maximum number of
different Context Input Values for direct display of the averages for each
Input Value |
|
MaxVirtualVariations |
15 |
Number of different
virtual Context Input Values |
|
ProbLevels |
50,100,150$ |
Probability Analysis
trigger levels as Amount in $ |
|
ProbLevel |
2 |
Probability Level to be
used for global Probability Average (2=middle level = $100) |
|
ProbAvgPer |
5 |
Number of bars used for
the Strategy Probability Average calculation |
|
ChkRRScope |
NO |
Check if current RRSCope
matches the selected refresh filelist |
Initial Data Conversion Settings
In this section you can
adjust settings related to the one time initial dataconversion
from the btwf2(Trade events) to the final btwf3(Positions) data file:
|
Name |
Default |
Description |
|
PreSortData |
NO |
Sort raw event data
(btwf2) by input values first |
|
StockTradeAmount |
100000$ |
For Stocks: Standard
Trading Size in $ |
|
WaitSec |
30 |
Number of seconds to wait
before the Automated Conversion starts after the TS Optimization has finished |
|
EventScan |
YES |
Perform a quick scan thru
all events to determine the type of position change which can occur |
|
MaxPosKillLookback |
100 |
Maximum number of
positions per permutation to lookback during the initial data Conversion |
|
MaxPosShow |
10000 |
Maximum number of
positions allowed per Trade Permutation |
|
MaxPosEqualCheck |
100000 |
Maximum number of
positions when the CPU intensive position duplication check is turned OFF |
|
MaxEvtLoad |
20000000 |
Maximum number of Events
to load (more will be truncated) |
|
SizeConfirm |
100000000 |
Filesize (in bytes) to
confirm loading (0=no confirm) |
|
StockUseTrdAmt |
YES |
For Stocks: Ignore input
volume and calculate size for fixed standard trading size (see
StockTradeAmount) |
|
ExportEvents |
NO |
During the initial
conversion (Event -> Position) |
|
EvtExportMin |
0 |
Starting Event Sequence
Number (0=first Event) |
|
EvtExportCnt |
1000 |
Number of Events to be
exported (from EvtExportMin) |
|
SkipInp |
0 |
Number of Input Parameters
to be skipped (rarelly used) |
Position Exit Manager (PEM) Settings
In this section you can
adjust settings related to the Position Exit Manager (PEM), which is used in
Potential Mode during the exit optimization:
|
Name |
Default |
Description |
|
MaxPEMOpt |
10 |
Maxmimum number of
Position Exit Manager Optimizations to show directly in the Treeview |
|
MaxExitResults |
5000 |
Maximum number of Position
Exit Results shown in the TreeView |
|
MininumExitPosCount |
2 |
Set the minimum number of
positions required for the Position Exit Mgr Result List |
|
PEMUpDownSteps |
3 |
Number of up and down
steps in creating a definition around the optimum |
|
PEMVerbose |
0 |
Set the level of
diagnostic messages from the Position ExitMgr in the log file |
General Settings
In this section you can
adjust settings related to the general BTWFMgr behavior:
|
Name |
Default |
Description |
|
OpenLastFile |
YES |
YES=On startup open the
last BTWFMgr data file (default) |
|
CsvViewer |
CsvViewer.exe |
Designate the default CSV
File Viewer program location |
|
DRIVE |
C: |
Designate the main drive
(with colon!) were all BTWFMgr data and programs resides. |
|
StartingCapital |
10000$ |
Define the initial
Equity/Capital for the DrawDown Percent calculations (Min $10000) |
|
ExportTrdPerm |
NO |
YES=Export all
Trading/Potential Permutations to a tabbed text file(*.TAB) and them imports
to a MS Access Databse(.MDB). |
|
MinFreeRAM |
50.0MB |
Minimum free Virtual
Memory while processing the initial data - if less abort the conversion and
continue with the available data |
|
ShowProgress |
YES |
Display the progress bar
window while a processes is running |
|
ShowProgressLog |
NO |
Write each progress bar
window message also to the log (great for diagnostics) |
|
LogFileAppend |
YES |
Append new message to
existing daily log file |
|
LogFileFlushOnEach |
NO |
Write each log mssage
physically to disk |
|
RefreshFileAssociations |
NO |
Reinitialize(YES) the
connection between the BTWFMgr files and BTWFMgr |
|
WelcomePend |
NO |
Show Welcome and initially
import the EasyLanguage Logic is into TradeStation |
|
FileMode |
0 |
File Caching Mode (0=in
RAM(recommended), 1=on Disk, 2=no caching(slow) |
|
FastExit |
YES |
Use fast exit method (dont
free each allocated memory fragment) |
|
|
|
|
Chart Settings
In this section you can
adjust settings related to the Chart settings:
|
Name |
Default |
Description |
|
ShowOneDay |
NO |
Stop the Position Bar
Chart display when the day ends |
|
LineWidth |
2 |
Thickness of lines in the
chart (in pixels) |
|
MaxGridLines |
20 |
Max Number of X Grid Lines
in Equity and Potential Graphs |
|
AxisMarkX |
4 |
Horizontal Axis (X) grid
marker length in pixels |
|
ZeroWidth |
4 |
Width of zero line in
pixels |
|
BBWidth |
2 |
Width of the Bollinger
Line in pixels |
|
BBStdDev |
2.0 |
In the Bollinger Band, set
the Standard Deviations |
|
BBAvgLen |
10 |
Bollinger Moving Average
Length |
|
BBColorDev |
Orange |
Bollinger Line Color |
|
BBColorAvg |
Magenta |
Bollinger Average Line
Color |
|
EquMedColor |
Blue |
Straight Medium Equity
Line Color |
|
EquMedWidth |
3 |
Straight Medium Equity
Line width in pixels |
|
BarsBeforeEntry |
10 |
Number of bars to show
BEFORE the position entry bar in the Position View Chart |
|
BarsAfterEntry |
100 |
Number of bars to show
AFTER the position entry bar in the Position View Chart |
|
InitBarDisplay |
D1/30 15:20 |
In the Bar Data Display
Mode define the Starting point for the Chart display - Two formats are available: |
Installing BTWFMgr
Download the current free BTWFMgr trial copy from:
www.profsoftware.com/bt/dl.htm
The internet browser will show
the download box:
Click on the RUN button
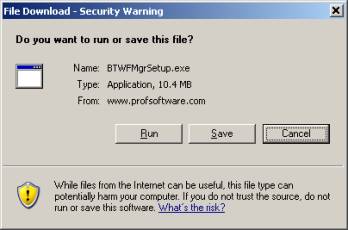
You will see the progress of the download …
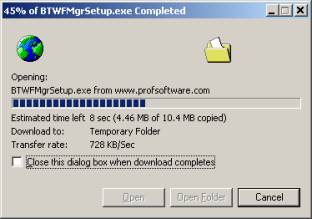
When the download has completed – confirm the BTWFMgr installation: Click on
the RUN button
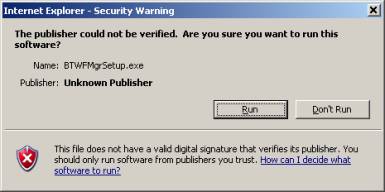
After a few seconds the actual BTWFMgr installation will start: Click on the
NEXT button
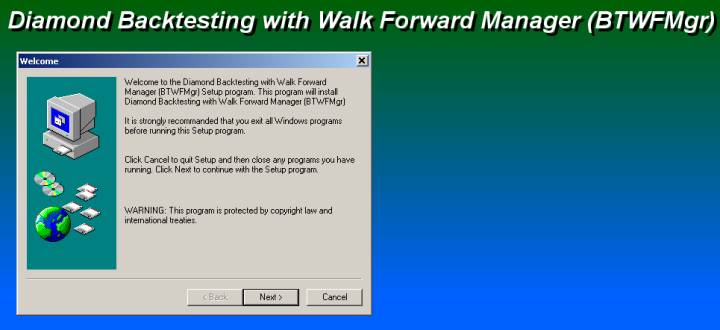
Click the NEXT button:
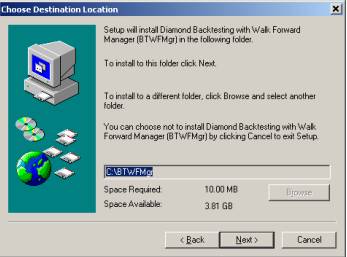
Click the NEXT button:
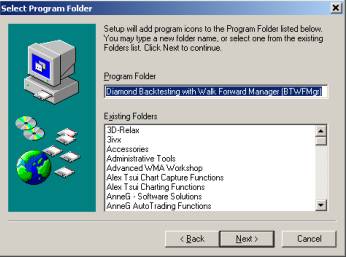
Click again the NEXT button
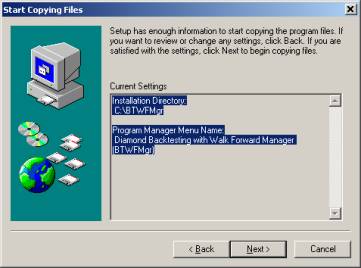
and the BTWFMgr will be finally installed … showing you the progress
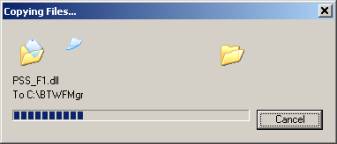
when the installation is completed – click on FINISH to start the BTWFMgr with
the sample data
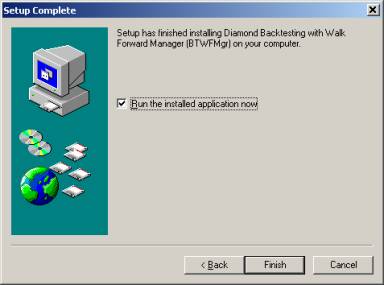
While the sample data is
installed the progress window will appear:
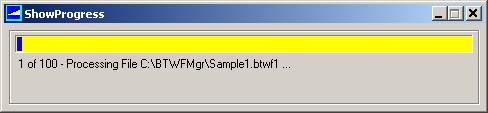
And after a few more
progress messages you will see:
click OK to start the import of the BTWFMgr function into TradeStation:
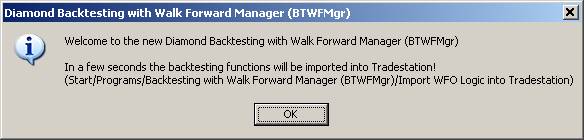
While you see the initial
main BTWFMgr window – TradeStation will start the Import Wizard;
you might have to login to TradeStation first.
Click on NEXT and follow the instructions:
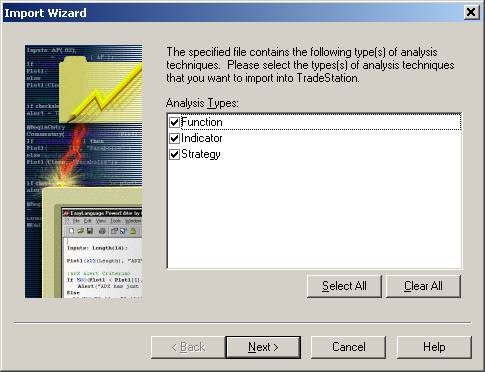
After the BTWFMgr function
have been imported into TradeStation– return to the main BTWFMgr display
Clicking on the yellow icon
at the bottom of your desktop – in the task list:
![]()
This will re-activate main BTWFMgr Window – showing you the Equity Graph of the
Sample File:
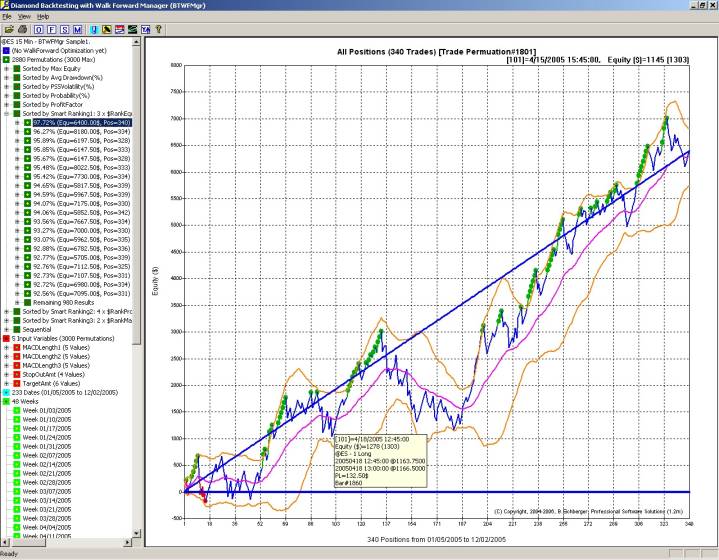
Now you are ready to use
BTWFMgr.
Glossary
|
BTWFMgr |
Diamond Backtest
and Walk Forward Manager |
|
Equ(Equity) |
BTWFMgr “Equity”
mode to detect the best performance for a strategy |
|
Entry Point |
The point in time
(i.e. a bar on the chart) |
|
Equity
Graph/Curve |
A graph showing
the accumulated equity of a sequence of positions |
|
Exit Point |
The point in time
(like a bar on the chart) |
|
Gross Profit/Loss |
The raw profit or
loss of a position |
|
Net Profit/Loss |
The actual profit
or loss of a position after the fees/fees are deducted |
|
PL |
Profit/Loss |
|
Position |
A position is a
completed buy/sell pair(Long Position) or short/cover pair (Short Position),
which results in a specific “gross profit/loss” and “net profit/loss” minus
the commission/fees. |
|
Potential/Pot |
BTWFMgr
“Potential” mode to detect the best entry point for a strategy |
|
Strategy Entry
Logic |
Logic which
determines when the strategy |
|
Strategy Exit
Logic |
Logic which
determines when the strategy is closing a position (sell/cover) |
|
Strategy Input Graph |
A chart showing the average “Strategy Potential” for each input value |
|
Strategy Input
Parameter |
A list of
variables which define the current actual values of parameters |
|
Strategy Input
Permutation |
A specific
combination of strategy input parameters |
|
Strategy
Potential |
The average
profit/loss of all entry points the strategy produced for a given
permutation, symbol and timeframe – plotted with elapsed time from entry |
|
Strategy
Potential Graph |
A chart showing
how the “Strategy Potential” develops over time/bars |
|
Strategy Preparation |
The automated process of adding a
small piece of code at the end of your strategy logic for the BTWFMgr data
collection. |
|
Trade Frequency
Graph |
A chart showing
the number of trades(long/short/all) for each parameter |
|
Trading Strategy |
logical steps
which produce “Entry Points”(Buy/Short) and |
|
WFA |
WFA = Walk
Forward Analysis |
|
Walk Forward
Analysis |
a step by step
verification how predictive/robust the strategy performance is |
(Last
Update Nov 10th, 2014)