Universal Trend Detection System (UNITRDES)
"Never
miss a trend again"
(developed
by Professional Software Solutions - 35+ years software development)
Copyright ã 2004-2014
by Burkhard Eichberger. All rights reserved.
No part of this book may be reproduced in any form or by any electronic or
mechanical means including information storage and retrieval systems
without permission in writing from the author (pss@poboxm)
(UNITRDES Version 1.4)
TABLE OF CONTENTS
Universal Trend Detection System
(UNITRDES) - Overview
Opening your first Trend Sample
Universal Trend Detection - Sample
Charts
GOOG Stock 30Minute Intraday Sample
(GOOG_I30)
AAPL Stock 30Minute Intraday Sample
(AAPL_I30)
USO ETF Daily Sample1 (USO_D1)
XLF ETF 15Minute Intraday Sample
(XLF_I15)
FOREX EURUSD 30Min Intraday Sample
(EUR_I30)
ES SP500 eMini Futures 5Minute
Intraday Sample (ES_I5)
Euro Futures 5Minute Intraday
Sample (EC_I5)
EC Futures 15Minute Intraday Sample
(EC_I15)
Crude Oil Mini Futures 5Minute
Intraday Sample (QM_I5)
10Year Treasury Futures 5Minute
Intraday Sample (TY_I5)
USO ETF Daily Sample2 (USO_D2)
Trend Scope Parameter (UTScope)
Trend Strength Detection (Trend
Stages)
Trend Sensitivity Parameter
(UTStep)
How to add trend coloring to your
chart (PaintBar)
How to add the automated Trend
Strategy to your chart
Trend Strategy specific Parameters
Backtesting the Universal Trend
Detection System
Syncronizing new Parameter with
PaintBar and Indicator
Suggested Core Parameter Ranges
Suggested secondary trading
Parameter Ranges
Viewing internal Values –
Commentary Box
PaintBar Study (UT_Bars) Below is the code for the
PaintBar Study (UT_Bars): Inputs:
Automated Trading Strategy (UT_TRD)
Other Professional Software
Solutions (PSS) Products
Diamond Backtesting and
Walk-Forward-Backtesting Manager (BTWFMgr)
Backtesting Sequence and Automation
Manager
Universal Trend Detection System (UNITRDES) - Overview
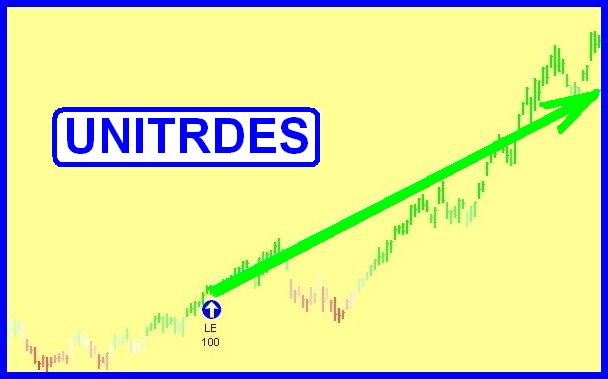
Welcome to the powerful new
“Universal Trend Detection system (UNITRDES)“,
which can assist you in
detecting a trend and improve your trading in the following ways:
- Instant intuitive paint bar coloring showing the
current market conditions
and trend in real-time - using a proprietary continuous coloring scheme (UT_Bars) - Automated Trading System (UT_TRD)
- Evaluating the trend strength and duration with
additional available indicators (UT_Trend)
UNITRDES is truly universal
and can be used and applied to:
- Stocks (AAPL, GOOG, INTC etc)
- ETF’s (USO, SPY,
DIA etc)
- Futures (E-Mini ES,
NQ etc)
- FOREX (EURUSD etc)
- Any timeframe (Daily and Intraday Minutes,
ticks, volume)
All parameters are easily adjustable for best performance in your market –
details below.
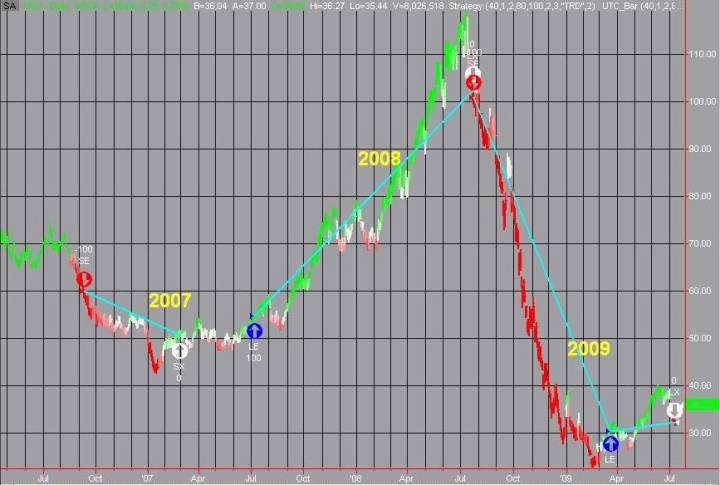
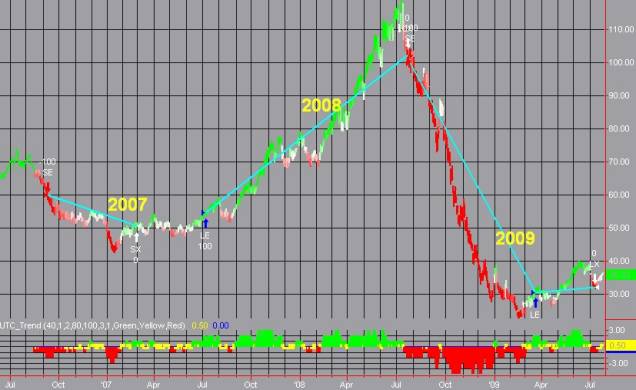
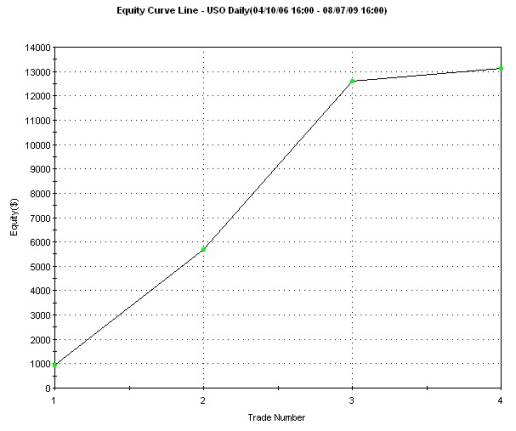
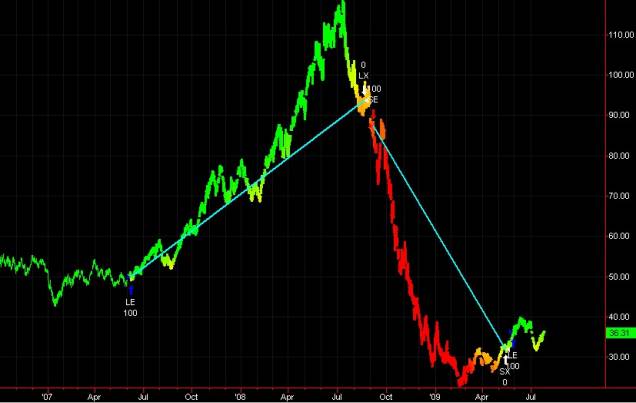
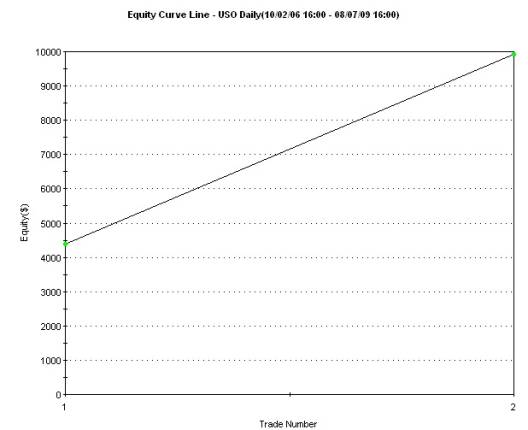
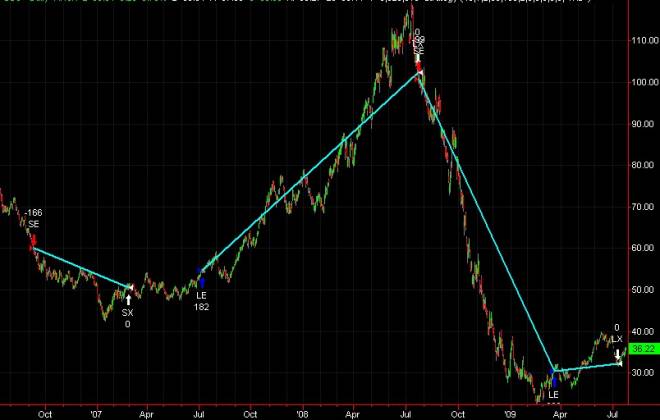
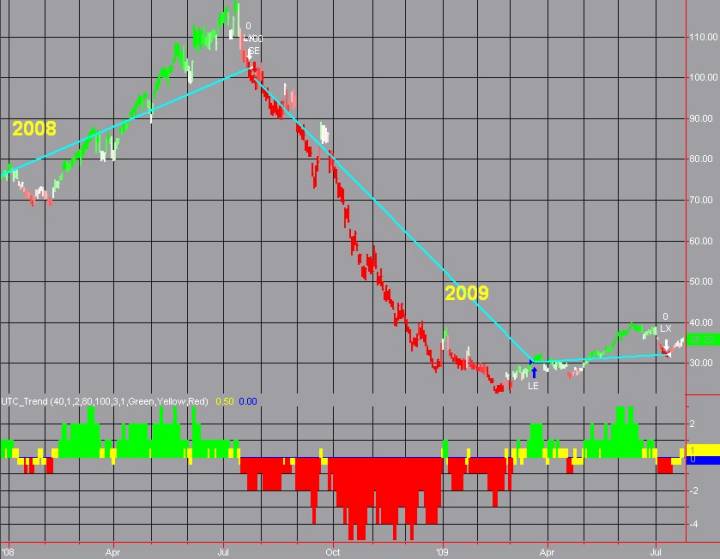
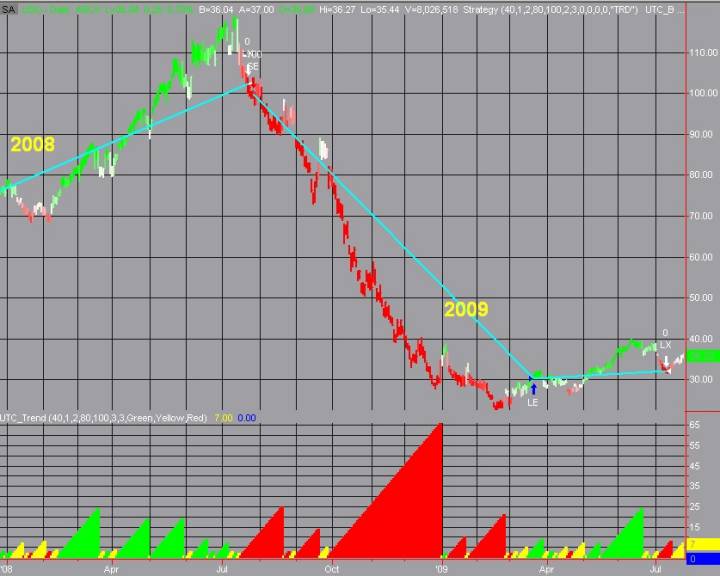
Here is an example of the
power of the UNITRDES trading system – using the Oil ETF(USO)
over the last 2.5 years – it gained
178% in 2 long and 2 short trades:
UNITRDES is using advanced proprietary statistical models and has been
developed by “Professional Software Solutions (PSS)” which extensive 30+ years
software development experience.
Check for updates and new versions at http://www.ProfSoftware.com/trend
Installation
The installation is easily completed within a
few mionutes.
Trial Period
You can try the “Universal Trend Detection
(UNITRDES)” for free for 14 days!
Download
Download and install from: www.profsoftware.com/trend/dl.htm
Close tradestation before
you start the installation, so the files are not “occupied” and the install
fails.
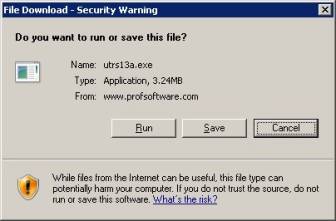
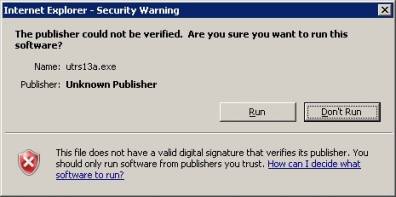
The internet browser will show the download
box- click on the RUN button:
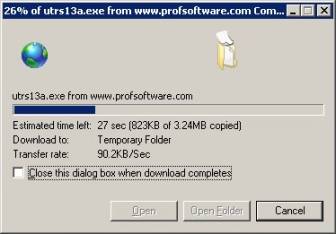
You will see the progress of the download …
When the download has completed – confirm the installation: Click on the RUN
button
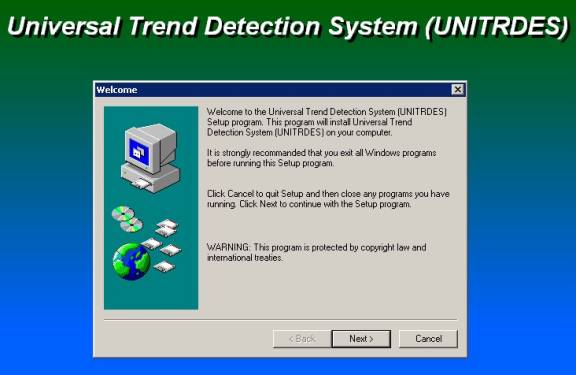
Setup
After a few seconds the actual installation
will start - click on the NEXT button
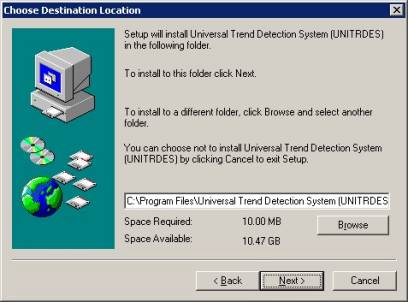
Confirm the location - click the NEXT button:
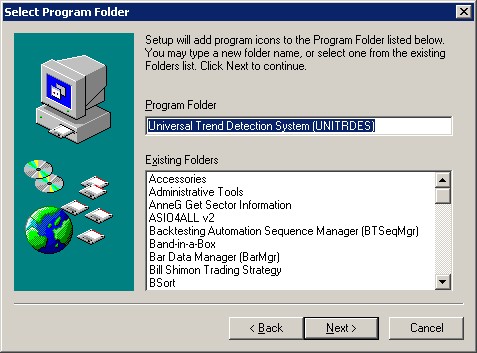
Confirm the Program Folder name - click the
NEXT button:
Confirm the settings - click again the NEXT
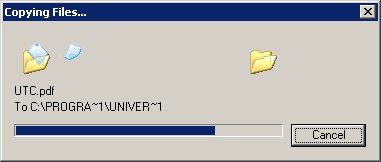
button
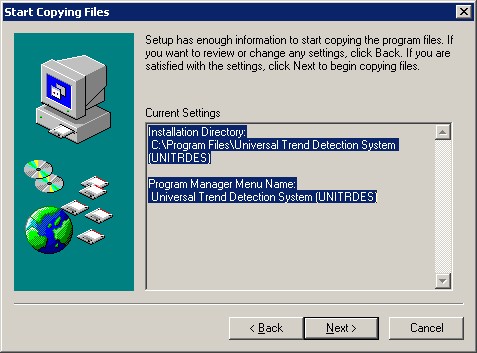
and UNITRDES will be finally installed … showing you the progress
When the installation is completed – click on
the FINISH button - to start the TradeStation logic import
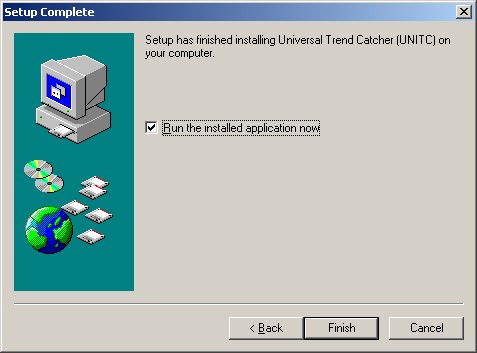
Tradestation Import
Login to TradeStation (unless already open)
and confirm the UNITRDES logic import – click on NEXT
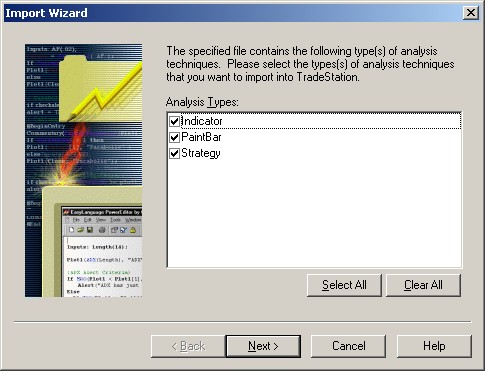
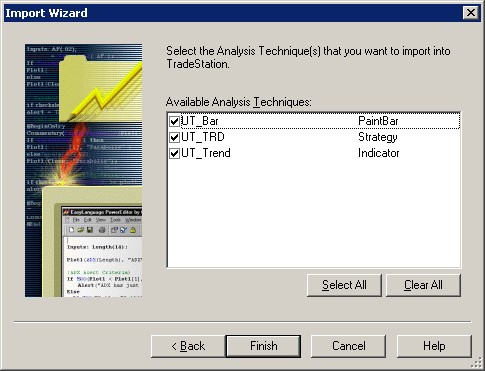
Confirm the import module list – click on
FINISH:
Opening your first Trend Sample
Now you can open the first UNITRDES Sample
file.
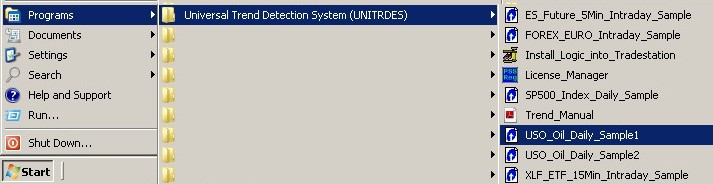
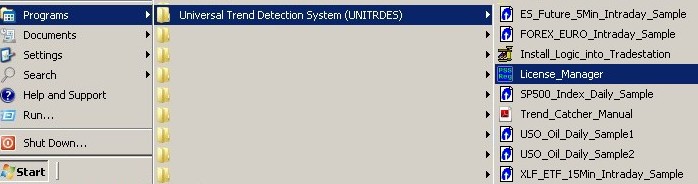
Click on Start/Programs and find the new
“Universal Trend Detection (UNITRDES)” entry
then select your sample - for example the “USO Oil Daily Sample1”:
(If you do not have the appropriate datafeed – then select a different sample)
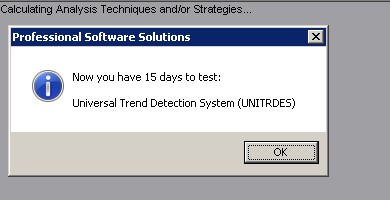
as soon as the data has loaded - you should
see the one time trial confirmation – click OK:
And the USO Daily Sample1 chart should
appear:

Now you are ready to use the “Universal Trend
Detection (UNITRDES)” system.
What is a Trend?
Here is the definition
from Wikipedia - http://en.wikipedia.org/wiki/Market_trends
“Market trends are described as sustained movements in market prices over
a period of time.”
The “Universal Trend
Detection (UNITRDES)” allows you to detect a trend in real-time.
You can customize the “period of time” with the UTScope parameter - as
the number of bars to be used.
You can customize also the detection of the “sustained movement” with
the UTStep parameter – see below.
A trend movement is
rarely completely smooth and unchallenged.
Usually the trend will experience a secondary counter trend, before it resumes
again.
Finally the trend will
have exhausted itself and either transition into a neutral sideways period
or a new counter trend will start. As you can see a “trend” is not a very
precise mathematical formula,
that’s why we give you several parameters to adjust the trend detection to your
preverences – see below!
Here is an example (USO Oil July to Oct 2007):
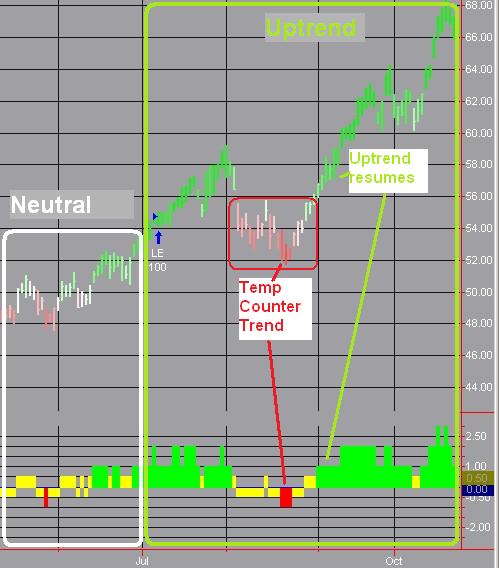
The “period of time” used here is 40 bars (UTScope=40) and strong sensitivity (UTStep=80)
Universal Trend Detection - Sample Charts
We have provides several
chart samples for the different markets and timeframes to demonstrate the power
and versatility of the “Universal Trend Detection System”.
Each sample can be accessed from the menu: Start/Programs/Universal Trend
Detection:
Or downloaded from: http://profsoftware.com/trend/home.htm#Samples
Downloading sample workspaces
Click on the links below
(after you install UNITRDES) to open the sample workspces:
GOOG Stock 30Minute
Intraday Sample
AAPL Stock 30Minute
Intraday Sample (AAPL_I30)
USO ETF Daily Sample1
(USO_D1)
XLF ETF 15Minute Intraday
Sample (XLF_I15)
FOREX EURUSD 30Min
Intraday Sample (EUR_I30)
ES SP500 eMini Futures
5Minute Intraday Sample (ES_I5)
Euro Futures 3Minute
Intraday Sample (EC_I5)
EC Futures 15Minute
Intraday Sample (EC_I15)
Crude3 Oil Mini Futures
5Minute Intraday Sample (QM_I5)
10Year Treasury Futures
5Minute Intraday Sample (TY_I5)
USO ETF Daily Sample2
(USO_D2)
DISCLAIMER:
Futures, stocks, and spot
currency trading have large potential rewards, but also large potential risk.
You must be aware of the risks and be willing to accept them in order to invest
in the futures, stocks, and forex markets. Don't trade with money you can't
afford to lose. This system is neither a solicitation nor an offer to Buy/Sell
futures, stocks or forex. No representation is being made that any account will
or is likely to achieve profits or losses similar to those presented here.
Past performance of indicators or methodology are not necessarily indicative of
future results.
CFTC RULE 4.41 - HYPOTHETICAL OR SIMULATED PERFORMANCE RESULTS HAVE CERTAIN
LIMITATIONS. UNLIKE AN ACTUAL PERFORMANCE RECORD, SIMULATED RESULTS DO NOT
REPRESENT ACTUAL TRADING. ALSO, SINCE THE TRADES HAVE NOT BEEN EXECUTED, THE
RESULTS MAY HAVE UNDER-OR-OVER COMPENSATED FOR THE IMPACT, IF ANY, OF CERTAIN
MARKET FACTORS, SUCH AS LACK OF LIQUIDITY. NO REPRESENTATION IS BEING MADE THAT
ANY ACCOUNT WILL OR IS LIKELY TO ACHIEVE PROFIT OR LOSSES SIMILAR TO THOSE
SHOWN.
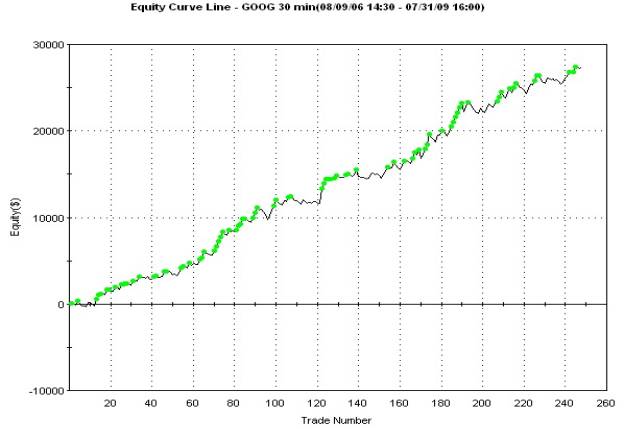
GOOG Stock 30Minute Intraday Sample (GOOG_I30)
Loads 12,001 bars from
July 31st, 2009:
Parameter: Scope=45, Smooth=3, Recent=-8, Step=50, CloseFac=100, Entry=3,
Exit=3, Tar=550
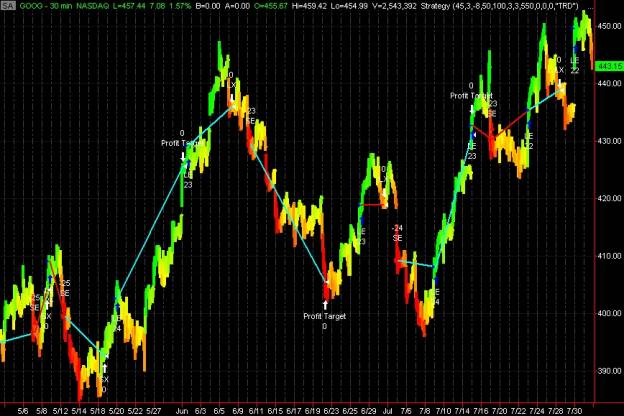
Performance:
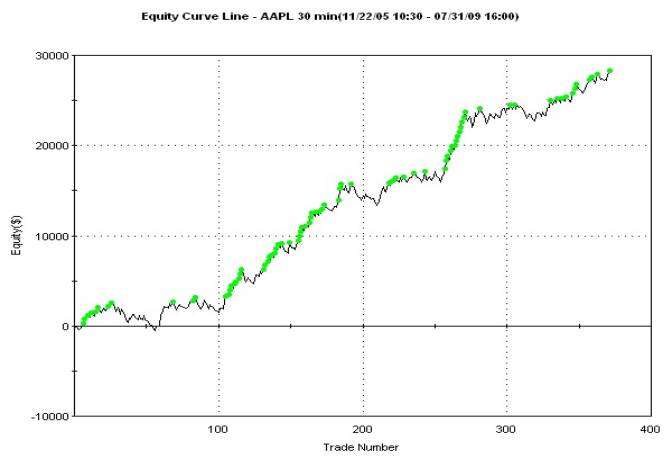
AAPL Stock 30Minute Intraday Sample (AAPL_I30)
Loads 12,001 bars from
July 31st, 2009:
Parameter: Scope=160, Smooth=1, Recent=-10, Step=60, CloseFac=100, Entry=3,
Exit=2, Tar=500
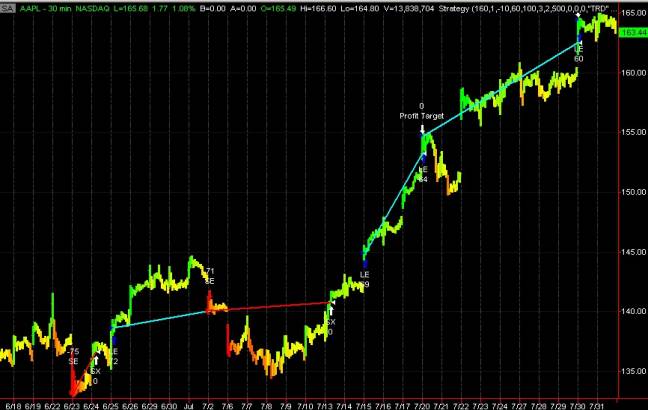
Performance:
USO ETF Daily Sample1 (USO_D1)
Loads 4 years from
July, 2009 and trades more frequently:
Parameter: Scope=40, Smooth=1, Recent=2, Step=80, CloseFac=100, Entry=2,
Exit=3, Tar=0
Performance:
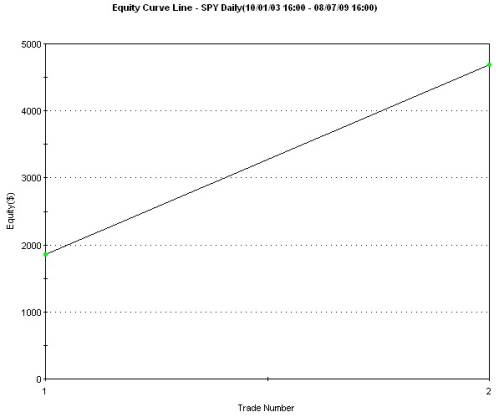
SPY ETF Daily Sample (SPY_D)
Loads Oct 2003 to July,
2009 and trades on major trend changes:
Parameter: Scope=200, Smooth=1, Recent=10, Step=115, CloseFac=100, Entry=2,
Exit=2, Tar=0
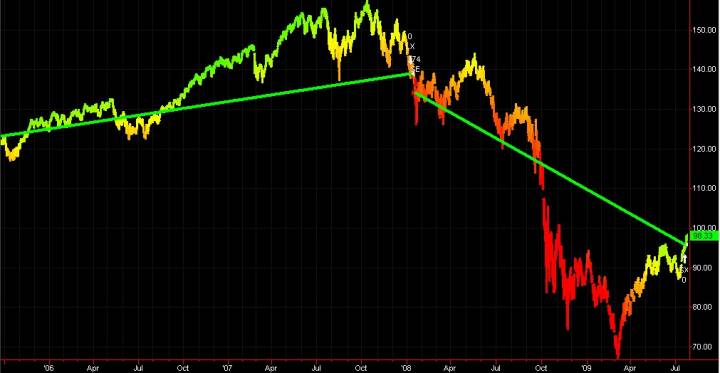
Performance:
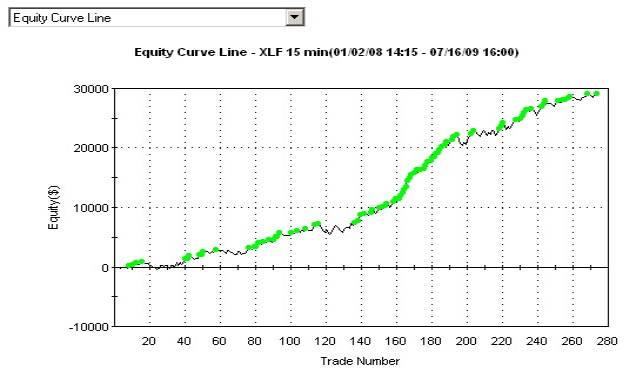
XLF ETF 15Minute Intraday Sample (XLF_I15)
Loads 10,001 bars from July 16th, 2009:
Parameter: Scope=30,
Smooth=3, Recent=2, Step=40, CloseFac=100, Entry=2, Exit=2, Tar=500
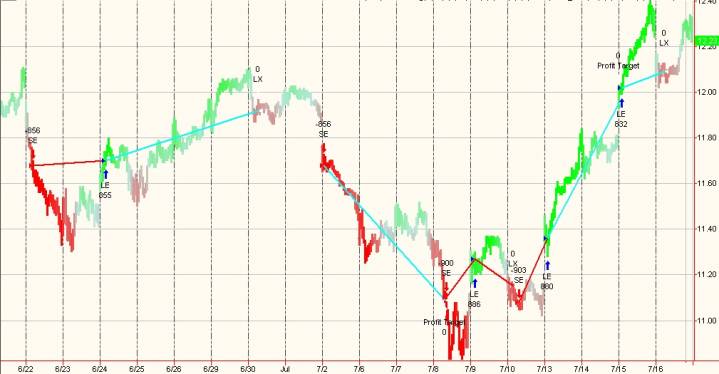
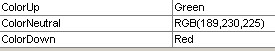
In this sample we used
a custom ColorNeutral:
To view the equity
curve of this(any) chart – click on View/Strategy Performance Report:
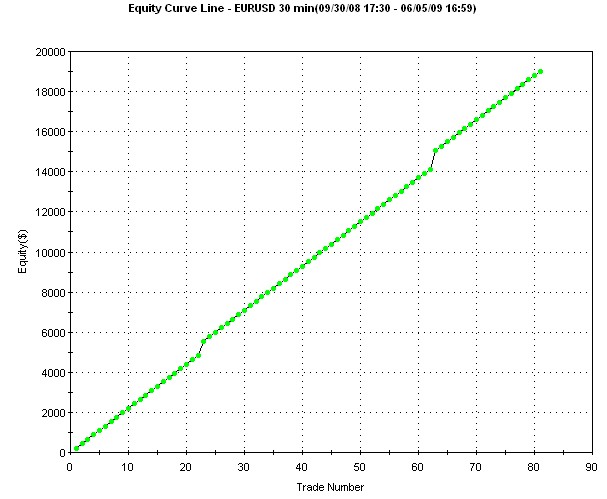
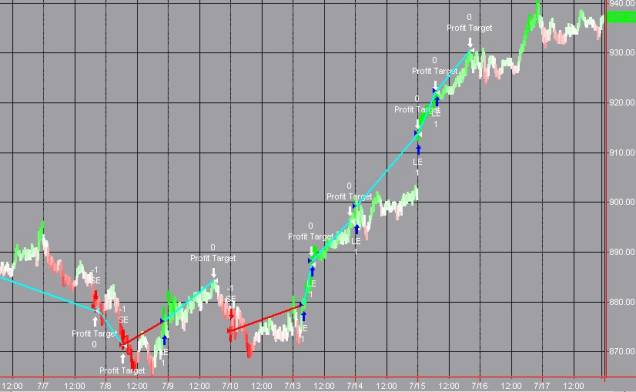
FOREX EURUSD 30Min Intraday Sample (EUR_I30)
Loads Oct 2008 to June
6th, 2009:
Parameter: Scope=100, Smooth=1, Recent=-10, Step=120, CloseFac=100, Entry=3,
Exit=8, Tar=220
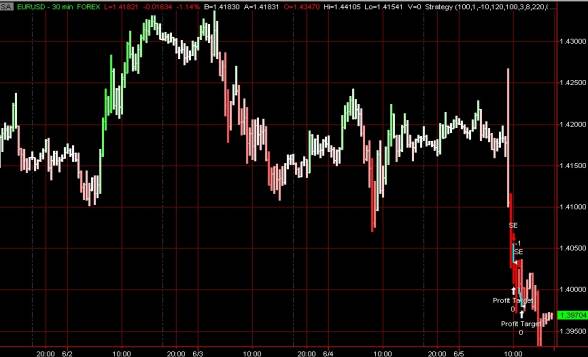
Performance:
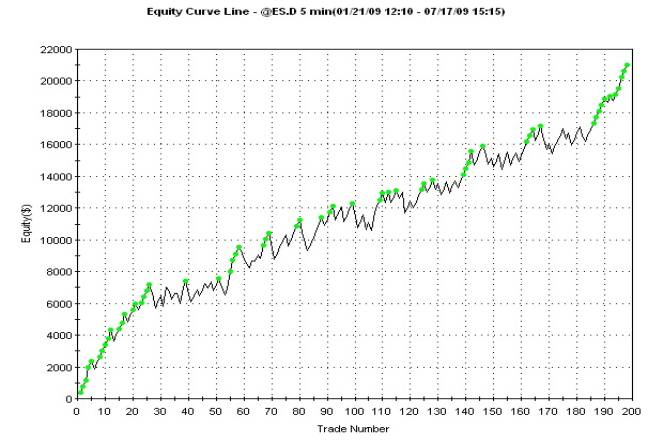
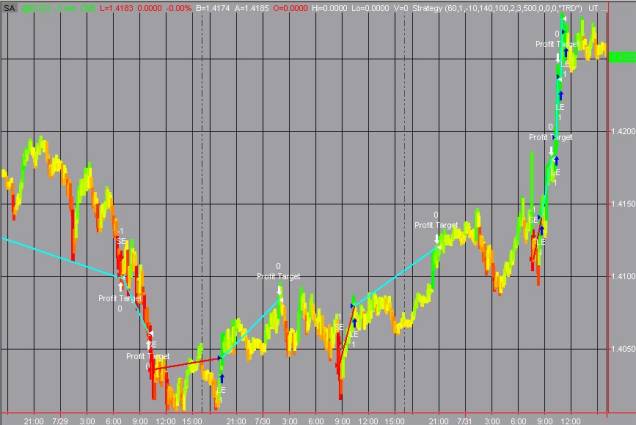
ES SP500 eMini Futures 5Minute Intraday Sample (ES_I5)
Loads 10,000 bars from July 18th, 2009:
Parameter: Scope=100,
Smooth=3, Recent=-10, Step=80, CloseFac=200, Entry=2, Exit=6, Tar=400
Performance:
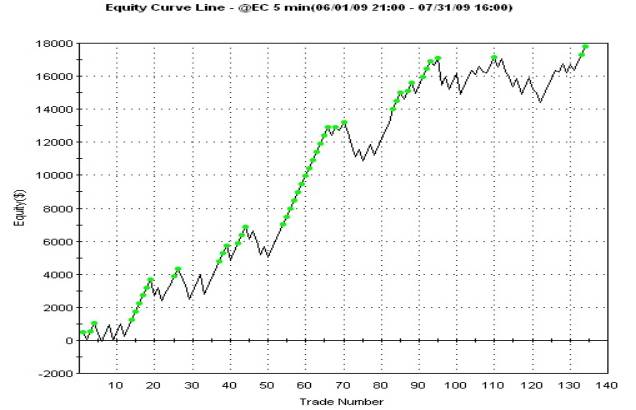
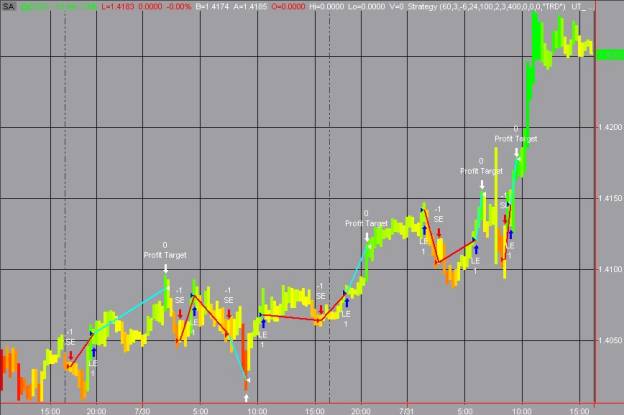
Euro Futures 5Minute Intraday Sample (EC_I5)
Loads 12,001 bars from
July 31st, 2009:
Parameter: Scope=60, Smooth=1, Recent=-10, Step=140, CloseFac=100, Entry=2,
Exit=3, Tar=500
Performance:
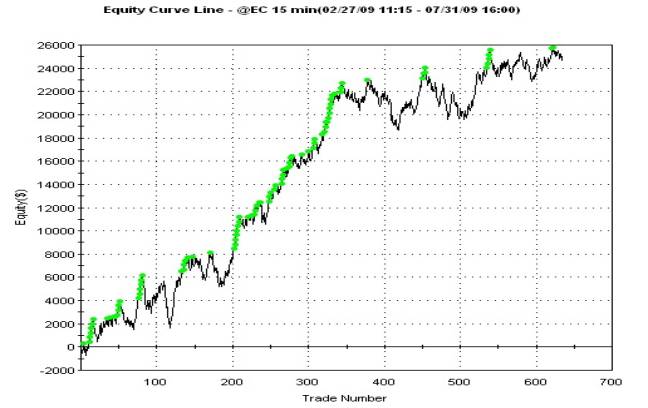
EC Futures 15Minute Intraday Sample (EC_I15)
Loads 10,001 bars from
July 31st, 2009:
Parameter: Scope=60, Smooth=3, Recent=-6, Step=24, CloseFac=100, Entry=2,
Exit=3, Tar=400
Performance:
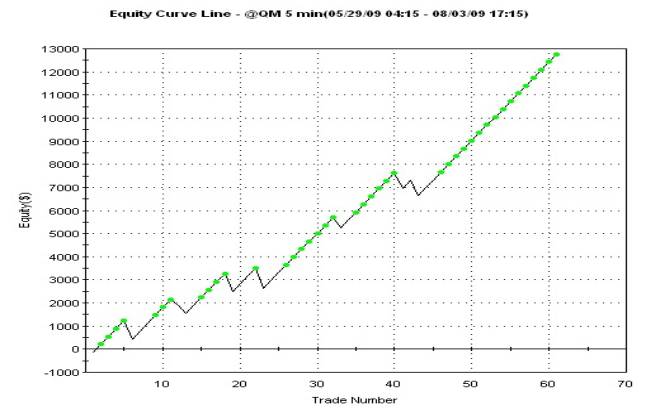
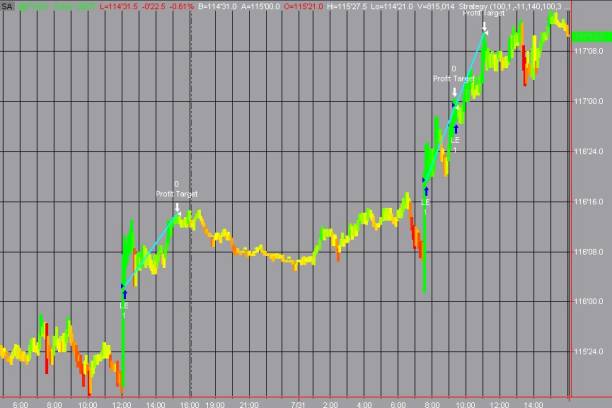
Crude Oil Mini Futures 5Minute Intraday Sample (QM_I5)
Loads 12,001 bars from
Aug 2nd, 2009:
Parameter: Scope=40, Smooth=1, Recent=-9, Step=160, CloseFac=100, Entry=3,
Exit=4, Tar=350
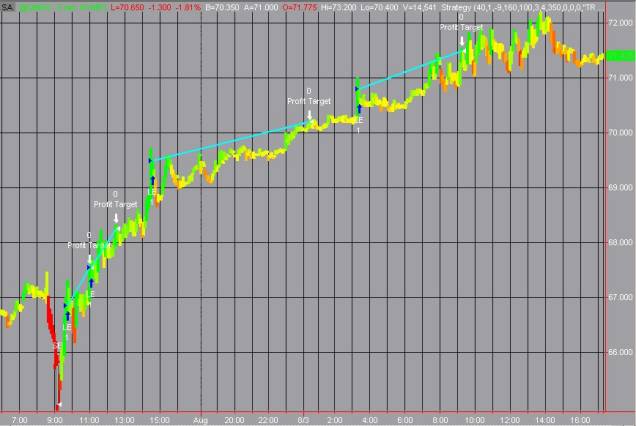
Performance:
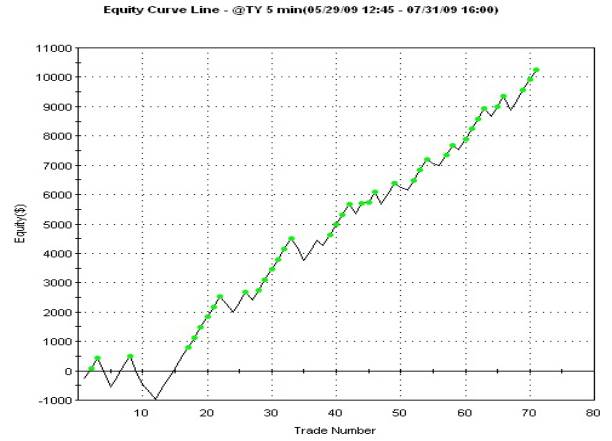
10Year Treasury Futures 5Minute Intraday Sample (TY_I5)
Loads 12,001 bars from
July 31st, 2009:
Parameter: Scope=100, Smooth=1, Recent=-11, Step=140, CloseFac=100, Entry=3,
Exit=3, Tar=350
Performance:
USO ETF Daily Sample2 (USO_D2)
Loads 4 years from July, 2009 and trades on major trend changes:
Parameter: Scope=120,
Smooth=2, Recent=9, Step=40, CloseFac=100, Entry=2, Exit=2, Tar=0
Performance:
Trend Scope Parameter (UTScope)
In order to detect a
trend the system has to “look back” a certain period of time (number of bars)!
UNITRDES allows you to adjust this period with the “UTScope” parameter.
The range of the scope is usually between 20 and 200 bars.
Short periods (less than 40 bars) react very quickly, but can give a few “false
alarms”, while
long periods (more than 80 bars) take some time to respond, but than the trend
is usually “more solid”.
Trend Strength Detection (Trend Stages)
The system can detect
not only the trend direction, but also the STRENGTH of the trend!
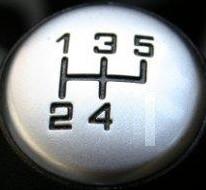
It will “grade” the strength of the trend between 1(weak) and 5(very strong);
just like the speed in a car relates to the gear you are driving:
Up trends are indicated with the positive stages (+1 to +5) - down trends with the negative stages (-1 to –5):
|
Grade |
Trend |
Strength |
|
+5 |
Up |
Very strong up
trend (max up strength grade limited to +5) |
|
+3, +4 |
Up |
Strong up
trend |
|
+2, +1 |
Up |
Slight –
possible start of an up trend |
|
0 |
Neutral |
No trend yet
detected |
|
-2, -1 |
Down |
Slight –
possible start of a down trend |
|
-4, -3 |
Down |
Strong down
trend |
|
-5 |
Down |
Very strong down
trend (max down strength grade limited to –5) |
Giving you a total of
11 stages (5 + 1 + 5).
You can adjust the sensitivity – how easy or hesitant – it notches up and down
the 11 trend grades shown above - with the UTStep parameter.
You can see the strength in the “Trend Indicator” and with the depth of the
color in the painted bar color.
Trend Sensitivity Parameter (UTStep)
This sensitivity
parameter allows you to adjust how quick the system will transition
from neutral to the up (or down) trend stages.
The range of the sensitivity is usually between 20 and 200, which 20 being VERY
sensitive and 200 needing a lot of confirmation.
Core Trend Parameters
The following parameters are
identical to all three UNITRDES modules:
- paint bar coloring showing the current market
conditions
and trend in real-time - using a proprietary continuous coloring scheme (UT_Bars) - Automated Trading System (UT_TRD)
- Evaluating the trend strength and duration with
additional available indicators (UT_Trend)
They can easily be adjusted
for best performance in your specific market and timeframe.
UNITRDES is using advanced proprietary statistical models to detect trends,
but keeps the implementation as simple as possible, since usually in trading
“simple is better”.
UNITRDES will apply its calculations and statistics to the “lookback” period
you define.
For example period of 50 (UTScope=50) would use the last 50 bars back from the
current bar.
The general UNITRDES
parameter are:
|
Name |
Default |
Description |
Range |
||||||||||||
|
UTScope |
40 |
Defines the “scope” of the lookback range: |
3…999 |
||||||||||||
|
UTSmooth |
1 |
Defines the how much smoothing should be applied:
|
1…99 |
||||||||||||
|
UTRecent |
2 |
Defines how much emphasis is on the most recent data
|
-20…+20 |
||||||||||||
|
UTStep |
80 |
Defines the sensitivity to notch up and down the trend
grades:
|
20…999 |
||||||||||||
|
UTCloseFac |
100 |
Defines how much emphasis is given to the closing price of
the last bar:
|
0…999 |
Trend Coloring in real-time
The “Universal Trend
Detection (UNITRDES)“ responds in real-time instantly to trend changes!
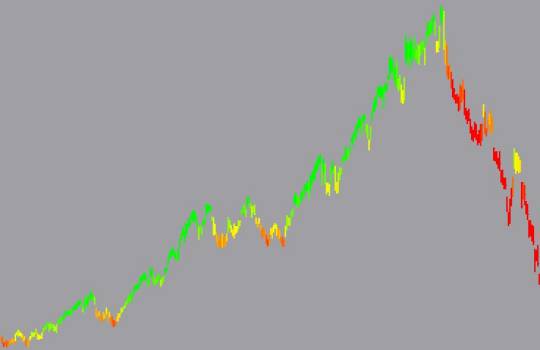
We are using an intuitive and continuous coloring scheme to show you the trend.
You can customize the colors to your preference:
·
Green (trend up)
·
Red (trend down)
·
Yellow (no trend –
neutral, sideway)
Here is an example of the smooth continuous color transitions between the color “corner stones”:
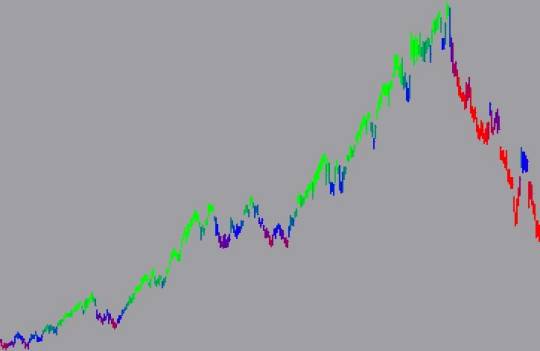
Of cause you can change the color preferences!
In the example below -we changed the color for the neutral trend from yellow to
blue:
How to add trend coloring to your chart (PaintBar)
To
add the “Universal Trend Detection (UNITRDES)“ color module to your chart:
- Open your chart
- Select Insert/PaintBar:
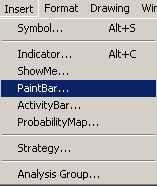
- A list of available PaintBar studies will come
up – select UT_Bar and click OK:
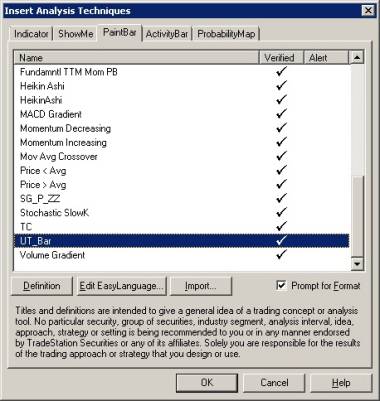
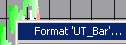
- To customize the trend and color settings;
right click on the prices and select Format “UT_Bars”:
- Now you can change the trend calculation
parameter and color parameter:
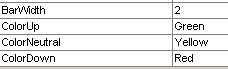
The “BarWidth” defines the thickness of the bar and can be between 0 and 6:
0=very thin, 6=very thick and all grades in between.
You can define any color in any of the three color settings – see below.
Trend Color Parameters
You can use any of the
predefined colors available:
|
Name |
RGB Value |
Number |
|
Black |
0 |
1 |
|
Blue |
16711680 |
2 |
|
Cyan |
16776960 |
3 |
|
Green |
65280 |
4 |
|
Magenta |
16711935 |
5 |
|
Red |
255 |
6 |
|
Yellow |
65535 |
7 |
|
White |
16777215 |
8 |
|
DarkBlue |
8388608 |
9 |
|
DarkCyan |
8421376 |
10 |
|
DarkGreen |
32768 |
11 |
|
DarkMagenta |
8388736 |
12 |
|
DarkRed |
128 |
13 |
|
DarkBrown |
32896 |
14 |
|
DarkGray |
8421504 |
15 |
|
LightGray |
12632256 |
16 |
You can also define your own
custom color using the Red/Green/Blue components:
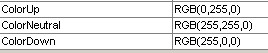 RGB(0,255,0) means 0=Red, 255=Green, 0=Blue
To find the RGB values for your colors open “Paint: - Start/Run enter “mspaint”
and click on ENTER
Then click on Colors/Edit
Colors and the color editing tool appears – click on “Define Custom Color”:
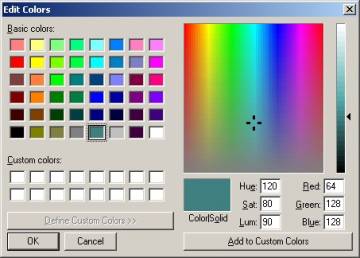
In this example:
Red=64, green=128, blue=128 - Enter RGB(64,128,128) in the value column:
![]()
How to add the automated Trend Strategy to your chart
The “Universal Trend Detection system (UNITRDES)“ also contains an automated trading system
You can customize to your objectives, trading style, market and timeframe.
To add the “Universal Trend Detection system (UNITRDES)“ strategy to your chart:
Open your chart or create a new chart (USO – Daily – 4 Years back)
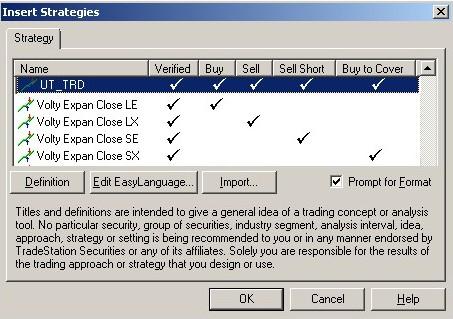
Select Insert/Strategy
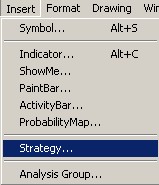
Scroll down – click on
UT_TRD – and click on OK.
(check the “Prompt for Format” box)
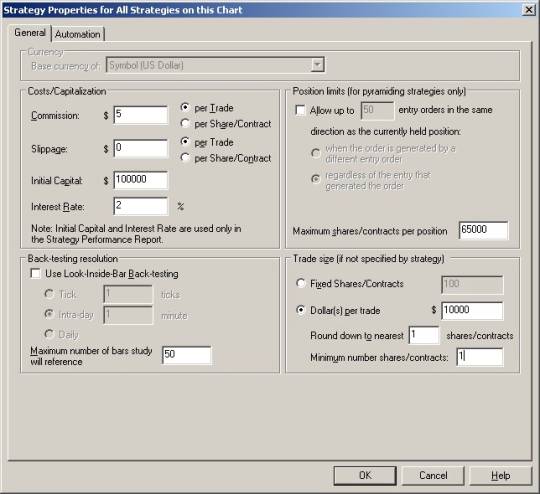
Enter your general
Strategy parameter – click on “Properties for all”
Enter the appropriate
commission per trade or share etc – then click OK:
(For stocks/ETF’s set the trading amount o $10000 and the rounding to 1 share)
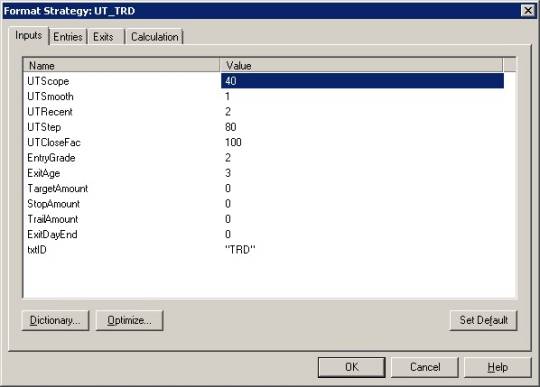
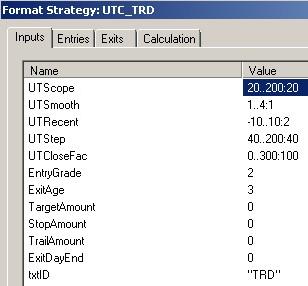
Click on Format to set
the strategy parameters as shown below – and click OK:
 :
:
To activate the
strategy finally click CLOSE – and you should see the signals in the chart:
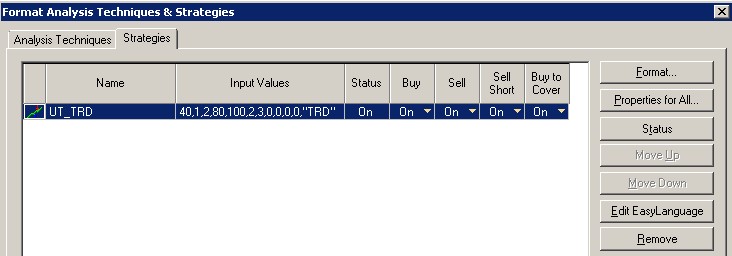
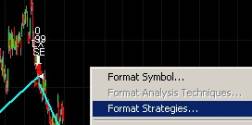
You can customize the
way the trades signals are shown:
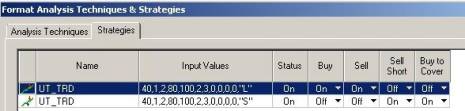
Just right click on the chart and select “Format Strategies”:
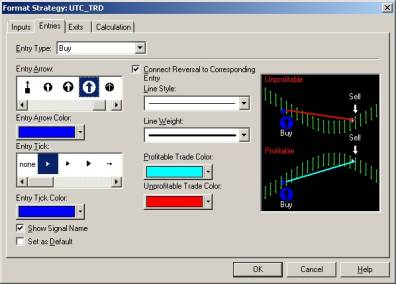
Then click on FORMAT
and click on the Entries or Exit TAB and
customize the settings how to show the entries and exits etc:
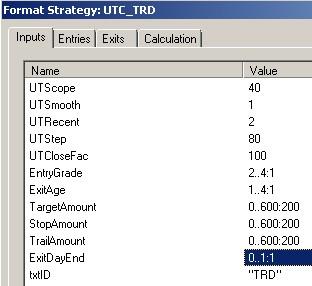
Trend Strategy specific Parameters
The “Universal Trend Detection system (UNITRDES)“ strategy contains the of caue the core parameter – see above – plus the additional trading related parameter shown below:
|
Name |
Default |
Description |
Range |
||||||||
|
EntryGrade |
2 |
Defines how quickly the entry is triggered:
|
1…5 |
||||||||
|
ExitAge |
3 |
Defines the how many bars to wait of the opposite trend:
|
1…99 |
||||||||
|
TargetAmount |
0 |
Defines the (optional) amount to exit with a gain – per
trade:
|
0, 1… |
||||||||
|
StopAmount |
0 |
Defines the (optional) amount to exit with a loss– per
trade:
|
0, 1… |
||||||||
|
TrailAmount |
0 |
Defines the (optional) trailing stop amount to exit with a
loss– per trade:
|
0, 1… |
||||||||
|
ExitDayEnd |
0 |
Defines the (optional) switch if to exit at the end of the
day/session:
|
0, 1 |
||||||||
|
TxtID |
"TRD" |
Text parameter for the case if you want to run several
instances |
|
Backtesting the Universal Trend Detection System
You can easily identify
the best UNITRDES trend and trading parameters,
this is called “backtesting” or “optimizing” your automated trading strategy.
Entering your test range(s)
Click on the FORMAT button in the strategy window.
Then click on the value you would like to “test”/optimize – for example TargetAmount.
Then click on the OPTIMIZE button and enter the testing range - $0 to $600 in $50 increments:
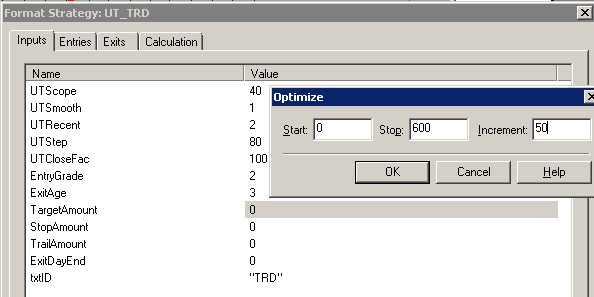
Tradestation will show
you the entered test values:
![]()
You can repeat this process for as many parameter you like – watch that you don’t get too many tests!
Start Optimization
Then click on the
“Optimize” button in the main strategy box, which will start the calculations:
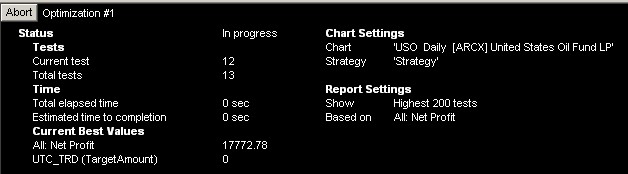
This process can take a
few seconds or several hours,
depending on the a) number of tests, b) number of bars in the chart and c)
UTScope parameter.
When the backtest has completed – the chart will refresh with the best result.
Backtesting is an
excellent tool to “what if” test your strategy and settings,
but watch out not to “curve fit” and “over optimize” and expect that same
performance in the future.
There are many books and approaches available on this complex topic.
To see the results and
equity graph (and many other statistics) click on the button in the toolbar:
(or click on View/Strategy Performance Report)
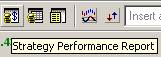
Click on the “Performance Graph” and you should see the equity curve:
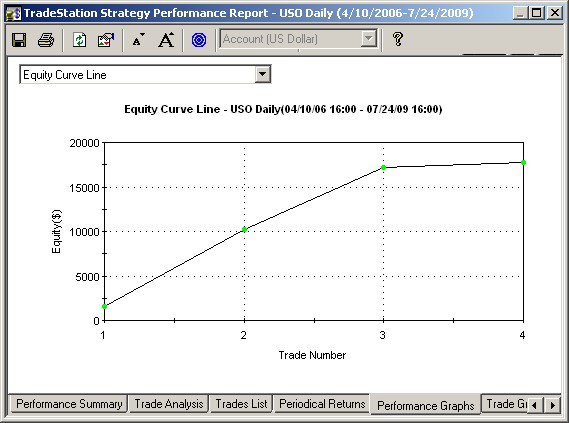
You can also see the
result for each test – click on the report button in thetoolbar:
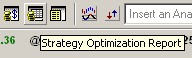
Which will display the result spreadsheet:
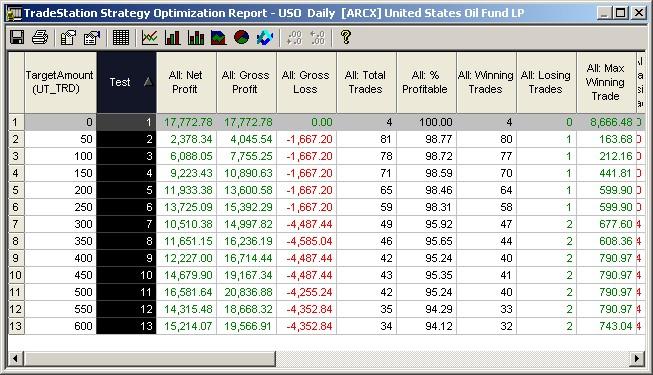
showing that no target (TargetAmpount=0) is indeed the best result for this particular chart.
Syncronizing new Parameter with PaintBar and Indicator
After you have backtested and possibly changed some the core UNITRDES parameter,
Remember to
“synchronize” these parameter in the UT_Bars paintbar study (if used).
Just right click on the bars and select “Format UT_Bars”:
![]()
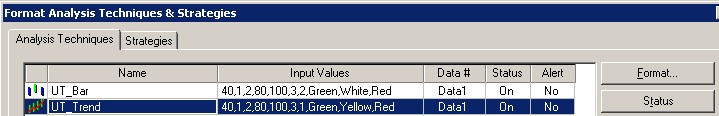
Also “synchronize” the UT_Trend
indicator (if used in chart).
Just right click anywhere on the chart background and select “Format Analysis
Techniques”
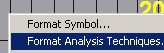
Then click on the UT_Trend Indicator and click on FORMAT and adjust the parameters
Suggested Core Parameter Ranges
Each change of a strategy
parameter usually has an effect on the result.
Below we are listing each “Universal Trend Detection system (UNITRDES)”
strategy trading parameter with their suggested backtesting range:
|
Name |
Range |
Increment |
Tests |
Impact |
Description |
|
UTScope |
20…200 |
20 |
10 |
Strong |
Lookback period to
calculate |
|
UTSmooth |
1…4 |
1 |
4 |
Medium |
Smoothing trend changes |
|
UTStep |
40…200 |
40 |
5 |
Strong |
Sensitivity to price
changes |
|
UTRecent |
-10…+10 |
2 |
11 |
Strong |
Emphasis on last prices |
|
UTCloseFac |
0…300 |
100 |
4 |
Slight |
Emphasis on last closing
price |
|
|
|
|
8,800 |
|
Total test |
We suggest first backtesting
these UT parameter with EntryGrade=2, ExitAge=3 and the rest 0:
This results in 8,800 tests.
Suggested secondary trading Parameter Ranges
Then backtest the remaining
strategy parameters:
|
Name |
Range |
Increment |
Tests |
Impact |
Description |
|
EntryGrade |
2…4 |
1 |
3 |
Strong |
Required trend strength to
enter |
|
ExitAge |
1…4 |
1 |
4 |
Strong |
Required opposing trend
duration for exit |
|
TargetAmount |
0…600 |
200 |
4 |
Strong |
When/if to take a profit |
|
StopAmount |
0…600 |
200 |
4 |
Strong |
When/if to use a fixed
stop loss |
|
TrailAmount |
0…600 |
200 |
4 |
Strong |
When/if to use a trailing
stop loss |
|
ExitDayEnd |
0,1 |
1 |
2 |
Medium |
When/if to exit at the end
of day/session |
|
|
|
|
1,536 |
|
Total tests |
This results in 1,536 tests.
Genetic Backtesting
Tradestation offers a new powerful backtesting method using a “genetic algorithm” (Version 8.5 and later).
For more details go to: https://www.tradestation.com/support/whats_new/build2274.aspx
And click on “New
Optimization Method Using Genetic Algorithm”
This new “genetic algorithm” allows you to test a much larger number of parameters and ranges
then the usual exhaustive backest!
Then you could test all the main parameter together:
|
Name |
Range |
Increment |
Tests |
Impact |
Description |
|
UTScope |
20…200 |
20 |
10 |
Strong |
Lookback period to
calculate |
|
UTSmooth |
1…4 |
1 |
4 |
Medium |
Smoothing trend changes |
|
UTStep |
40…200 |
40 |
5 |
Strong |
Sensitivity to price
changes |
|
UTRecent |
-10…+10 |
2 |
11 |
Strong |
Emphasis on last prices |
|
EntryGrade |
2…4 |
1 |
3 |
Strong |
Required trend strength to
enter |
|
ExitAge |
1…4 |
1 |
4 |
Strong |
Required opposing trend
duration for exit |
|
TargetAmount |
0…600 |
200 |
4 |
Strong |
When/if to take a profit |
|
|
|
|
105,600 |
|
Total exhaustive tests |
This would result in
105,600 test runs:
![]()
Switch to the smart “Genetic backtesting”:
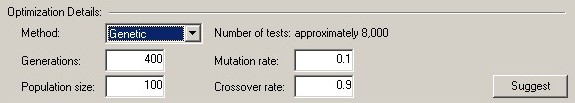
You can either enter the genetic parameters shown above – or click on the
SUGGEST button,
to have TradeStation provide some reasonable genetic parameter.
Trend Indicators
The “Universal Trend
Detection (UNITRDES)” offers also several indicators,
so that beside the bar coloring you can see also more exactly the trend
changes.
Let’s open the “USO Oil Daily Sample1”
Click on Start/Programs and “Universal Trend Detection (UNITRDES)” then select
the ““USO Oil Daily Sample1”
The USO Oil chart will
open with the additional indicator track at the bottom:
 By
default UT_Trend with the trend strength/grade, oscillating between +5(strong up)
0=neutral and –5(strong down).
By
default UT_Trend with the trend strength/grade, oscillating between +5(strong up)
0=neutral and –5(strong down).
You can see the neutral(yellow) zones and the extreme –5 zone on Oct 2008.
Now we switch to show
instead the age of the trend – right click on the indicator bars and select
Format UTD_Trend:
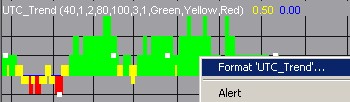
Change the UTStyle
from 1 to 3:
![]()
Which will show you
the age of the trend – which is used in the automated strategy to avoid a tiny
countermove to exit:
Trend Indicator Styles
The following Indicator styles (UTStyle) are available:
|
Value |
Description |
|
1 |
Show the trend grades (between –5, 0 and +5) |
|
2 |
Show the unclipped trend grades |
|
3 |
Show the trend age in number of bars |
|
4 |
Show the basic trend direction –1=down, 0=neutral, +1=up |
Requirements
The “Universal Trend
Detection (UNITRDES)” is compatible with TradeStation version 8.3 and above.
Since it is an add-on to tradestation, its (minimum) requirements are identical
to TradeStation’s requirements:
Processor: Single-core Intel® or AMD® processor at 1.5
GHz or faster, Memory (RAM): 2 GB,
Hard Drive: 300 MB free space 5400 RPM drive,Video Card(s): 16-bit graphics
support 64 MB for a single monitor,
Screen Resolution 1024x768 pixels, Operating
Systems: Windows® XP, Windows Vista®
Internet Connection: Broadband
Connection 1.5 Mbps or better
Uninstalling UNITRDES
Close Tradestation, so
UNITRDES are not “occupied”.
Then go to Start/Settings/Control Panel/Programs and Features.
Then scroll down to “Universal Trend Detection System (UNITRDES)”
Right click and select “Uninstall”
After a few seconds the “Universal Trend Detection System (UNITRDES)” will be
unistalled.
Viewing internal Values – Commentary Box
You can easily view all the internal values for any bar in your chart using the commentary feature:
Click on View/Analysis Commentary in Tradestation – then click on the bar you want to view.
Example: In the “USO Sample1” click on the 10/17/2008 bar and you should see the details for that bar:
Grade=-4(-4.90) Dir=-1 TrendAge=15
USO Daily [ARCX]
United States Oil Fund LP-10/17/2008
Strategy
(Strategy):
Bar#587 Close=59.37000 High=61.10000 Low=57.66000
Pos=-1 PosAge=58 Left=100 Entry=99.80000 ExitAge=61
Grade=-4(-4.90) Dir=-1 TrendAge=15
Scope=40 Smooth=1 Recent=2.0 Step=80 CloseFac=100 1.3a
UT_Trend
(Indicator):
Grade=-4(-4.90) Dir=-1
TrendAge=15
Scope=40 Smooth=1 Recent=2.0 Step=80 CloseFac=100 1.3a
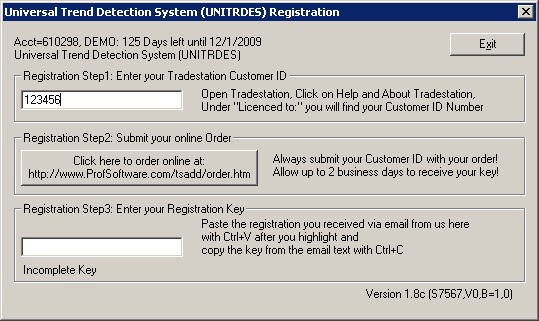
Registration & Licensing
The “Universal Trend Detection (UNITRDES)” license is attached to each unique Tradestation customer ID.
You can use the SAME UNITRDES license on several machines, if you use the same Tradestation login/CustomerID.
Each different Tradestation customer ID requires a new license.
To see your current
license status:
Click on Start/Programs/Universal Trend Detection(UNITRDES)/License Manager:
The current license status is shown at the top of the License Manager:
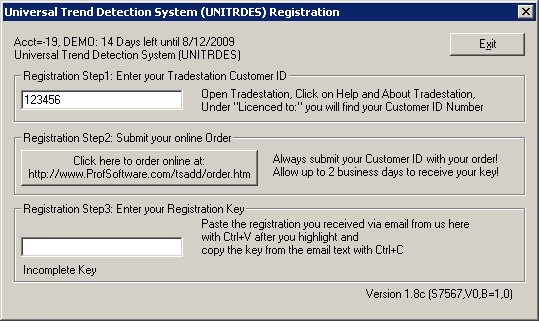
While the trial is
running it shows: DEMO: XX Days left until MM/DD/YYYY.
When the trial has expired it shows: DEMO: -N Days left until MM/DD/YYYY.
After you have
successfully placed your order you will receive a registration key – enter it
at the bottom:
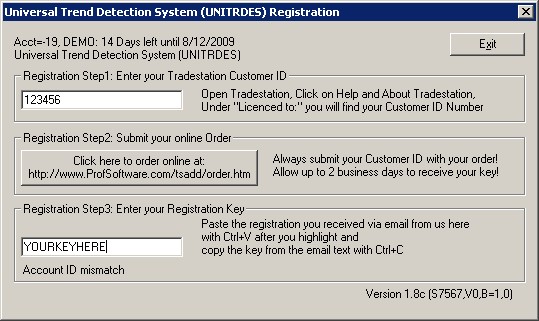
The License Manager will confirm your registration – click on OK:
Open the License
Manager again - and you will see the new extended expiration date in the status
message:
DEMO: XX Days left until MM/DD/YYYY.
Make a note of the new expiration date and submit your subscription extension
in time, so you have no lapse!
EasyLanguage Code
The code to program
the “Universal Trend Detection (UNITRDES)” in TradeStation is available and
can easily modified to fit your needs. All UNITRDES modules always call the
core calculation module (PSS_UTC.DLL)
With it’s proprietary statistical trend detection logic.
PaintBar Study (UT_Bars)
Below is the code for the
PaintBar Study (UT_Bars):
Inputs:
UTScope(50),
UTSmooth(1),
UTRecent(2),
UTStep(40),
UTCloseFac(100),
UTColorMax(3),
BarWidth(2),
ColorUp(Green),
ColorNeutral(Yellow),
ColorDown(Red);
Var: txtDiag("XXXXXXXXXXXXXXXXXXXXXXXXXXXXXXXXXXXXXXXXXXXXXXXXXXXXXXXXXXXXXXXXXXXXXXXXXXXX"),
txtID(Symbol +
"_BARS"),
ret(0);
Array: double arrVal[100](0);
{======
UT MODULE INTERFACE =========================================}
DefineDLLFunc:
"PSS_UTC.DLL", float , "PSS_UTC", LPSTR, LPDOUBLE, LPSTR;
arrVal[0]
= Date data1;
arrVal[1]
= Time data1;
arrVal[2]
= Open data1;
arrVal[3]
= High data1;
arrVal[4]
= Low data1;
arrVal[5]
= Close data1;
arrVal[6]
= Ticks data1;
arrVal[7]
= BarNumber data1;
arrVal[8]
= BarInterval data1;
arrVal[9]
= BarType data1;
arrVal[10]
= CustomerID;
arrVal[11]
= UTScope;
arrVal[12]
= UTSmooth;
arrVal[14]
= UTRecent;
arrVal[15]
= UTStep;
arrVal[16]
= GetBackgroundColor;
arrVal[17]
= ColorUp;
arrVal[18]
= ColorNeutral;
arrVal[19]
= ColorDown;
arrVal[20]
= UTCloseFac;
arrVal[21]
= UTColorMax;
ret
= PSS_UTC(txtID,&arrVal[0],txtDiag);
{======
PAINT BAR WITH CURRENT TREND COLOR ===========================}
IF
ret > 0 THEN
PlotPaintBar(High,Low,Open,Close,"Trend",arrVal[58],Default,BarWidth);
{======
PROCESS ERRORS ===============================================}
IF
ret < -100 THEN
RaiseRunTimeError(txtDiag);
After the input and
variable section the array with the current values is filled (arrVal[]).
Then the UNITRDES
calculation module is called “ret = PSS_UTC(txtID,&arrVal[0],txtDiag);”
and the result is processed – in this case a simple ”PlotPaintBar()”call with the
calculated color in arrVal[58].
The UNITRDES “ret” is always positive (the bar number) unless an error occurs.
Automated Trading Strategy (UT_TRD)
The strategy has essential the same code – just the following section is added for the actual strategy:
nGrade
= arrVal[57];
nTrendAge
= arrVal[60];
{======
ENTER WHEN ENTRY GRADE HAS BEEN REACHED ======================}
IF
ret > 0 THEN BEGIN
IF nGrade >= Pos(EntryGrade)
AND nGrade[1] < Pos(EntryGrade) then BEGIN
Buy("LE")
next bar Market;
END;
IF nGrade <= Neg(EntryGrade)
AND nGrade[1] >= Neg(EntryGrade) then BEGIN
SellShort("SE")
next bar Market;
END;
end;
{======
EXIT WHEN DIRECTION CHANGED ==================================}
IF
MarketPosition > 0 AND nGrade <= -1 AND nTrendAge > ExitAge THEN
Sell("LX") Next bar
Market;
IF
MarketPosition < 0 AND nGrade >=
1 AND nTrendAge > ExitAge THEN
BuyToCover("SX") Next
bar Market;
{======
OPTIONAL AMOUNT BASED EXITS ==================================}
IF
ExitDayEnd > 0 THEN
SetExitOnClose; //
exit at end of day/session
SetStopPosition;
IF
TargetAmount > 0 THEN
SetProfitTarget(TargetAmount); // target/gain reached
IF
StopAmount > 0 then
SetStopLoss(StopAmount); // fixed stop out
protection
IF
TrailAmount > 0 THEN
SetDollarTrailing(TrailAmount); // trailing stop
As you can see the logic checks if the “EntryGrade” has been reached/crossed,
Then enters long or short a new position at the open of the next bar as a market order.
If the trend has
reversed for at least the “ExitAge” number of bars the logic will exit.
If specified the strategy will also exit when the target, stop, trailing or end
of day condition is hit.
Trend Indicators (UT_Trend)
The indicator has
essential the same code – just the following section is added to display the
various indicator styles:
IF ret > 0 THEN BEGIN
nColor = ColorNeutral;
IF arrVal[61] < 0 THEN
nColor = ColorDown;
IF arrVal[61] > 0 THEN
nColor = ColorUp;
IF UTStyle = 1 THEN BEGIN // Show clipped Trend Grades -5 to +5
IF arrVal[57] = 0 AND arrVal[59] >= 0 THEN
arrVal[57] = 0.5;
IF arrVal[57] = 0 AND arrVal[59] < 0 THEN
arrVal[57] = -0.5;
Plot1(arrVal[57],"Trend",nColor);
Plot2(0,"Zero");
END;
IF UTStyle = 2 THEN BEGIN // Show unclipped Trend Strength
Plot1(arrVal[59],"Trend",nColor);
Plot2(0,"Zero");
Plot3(5,"TrendMax",ColorUp);
Plot4(-5,"TrendMax",ColorDown);
END;
IF UTStyle = 3 THEN BEGIN // Show Trend Age
Plot1(arrVal[60],"Trend",nColor);
Plot2(0,"Zero");
END;
IF UTStyle = 4 THEN BEGIN // Show Direction
Plot1(arrVal[61],"Trend",nColor);
Plot2(0,"Zero");
END;
END;
Other Professional Software Solutions (PSS) Products
“Professional Software Solutions (PSS)” has developed over the last 10 years several powerful software.
Each software comes with a free trial, so you can always test the software on your computer before you place your order.
Diamond Backtesting and Walk-Forward-Backtesting Manager (BTWFMgr)
http://www.profsoftware.com/bt - BTWFMgr offers the following major functions:
- Fully automated advanced
Walk Forward Algorithm (click for details),
providing you with realistic backtesting results, instead of the usual curve fitting unrealistic results
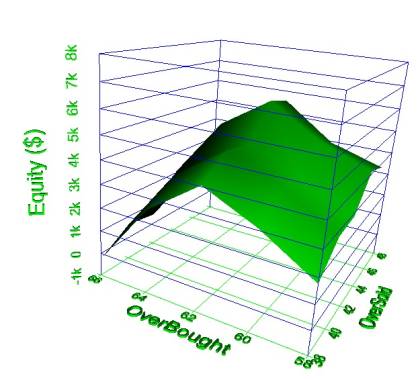
saving you hours and days of hard manual labor, displays results ar 3D View or spreadsheet Matrix. - Advanced visual
Strategy Input Parameter Analysis
providing you with a detailed visual analysis of the effect of EACH strategy input parameter variations on the overall result - 3D + 2D visual
Strategy Input Parameter Analysis
providing you with a 3D visual analysis of the effect of two strategy input parameters variations on the overall result
- Powerful &
innovative Trading Strategy Potential Analysis and Optimization
allows you to detect the maximum trading opportunities and parameter optimums - using ONLY ENTRY POINTS
before you develop the exit logic in your strategy. - New Trading
Probability Map
allows you to detect the maximum probability areas - using 3 profit levels and ONLY ENTRY POINTS - Identify the best
Weekdays and Intraday entry times
allows you detect the best (and worst) intraday entry times and weekdays for long, short and overall performance - Strategy Position Exit
Algorithm Optimization (using advanced integrated Position Exit Manager)
providing you with the best Position Exit Definition - an advanced algorithm combining several position exit function like:
exponential/linear Target, StopOut, Trailing, breakeven etc.
All operating at a lightning speed of around 100,000 tests per second (which would take TradeStation days) - Time and Weekday
Analysis
track which weekdays and intraday times are the best for long/short or overall trading - Trading Frequency
Analysis
track how many trades occur on a monthly, weekly, daily or based on any of the parameters - Visual Multi
Timeframe/Symbol Analysis - Result Overview Module
Detect the best performance from your symbol/timeframes backtest's sorted by Probability%, Yearly, PerTrdAvg or PeakAvg$ - Visual Profit/Loss
Distribution Analysis
showing average, best and worst positions profit/loss - Visual Permutation
Results Distribution Analysis
showing how equity, drawdown, probability etc is distruibuted across all trading permutations, detecting outliers easily. - Detect the
lowest Volatility
Find least nerve-wraking performance but with similar ending equity runs, usingthe integrated volatility analysis and smart ranking. - Export the results to
a Microsoft Access Database (MDB)
allowing you any advanced SQL queries and reports - to detect the best results - click here for an MDB example - Correlate
Context Values with best Potential
You can add any variable in Potential Mode to the backtesting, so you can detect any correlation between context variable range(s) and favorable potential results. - Instant Position
Viewing + Excursions
View the actual charts of each Position Entry, Exit and Risk/Reward excursion instantly - Advanced Strategy Performance Ranking
providing you with the a customizable powerful hybrid of Strategy result elements:
4x Equity AND 2xDownDraw AND 2xProfitFactor etc - Advanced Strategy Context Variables Analysis
detects potential connections between best results and certain value ranges of any variable - Instant Position Viewing
provides you - with a mouse click - with the actual charts of each Position Entry, Exit and Risk/Reward excursion instantly,
so you can evaluate also visually all entries and their performance - instead of using the cumbersome scrolling in the charts - You can merge results from different markets/symbols into one new comprehensive result/graph
- Even Optimize the your Walk Forward Filter and Sort Parameter, selecting the best result for the out-of-sample test
- Accumulate automatically all the Walk Forward out of sample results into one comprehensive continuous result spreadsheet
- Export any result to the advanced Performance Analyzer for in depth analysis by TimeOfDay, Weekday etc.
- Automated modification of your EasyLanguage Strategy Code, so you don't have to be familiar with EasyLanguge
- Export permutation statistics to a spreadsheet, for your custom analysis and sorting - click here Statistic example
- Multi Symbol/Basket testing with the new Backtesting Sequence Manager (BTSeqMgr) module
- BTWFMgr can also handle partial exits - for more details see here
Backtesting Sequence and Automation Manager
http://www.profsoftware.com/tsadd/btseq
- Save hours by
running automatically a customizable series of backtests with BTSeqMgr
for any list of symbols and timeframes (overnight or over a weekend) in TradeStation®
Example: Test your startegy on SP100 symbols for Daily and 30 minute charts - BTSeqMgr saves
automatically the workspace, spreadsheet and archive file for each
symbol+time frame
(with the Diamond Backtesting Module you can even save ALL optimization details and optimize your strategy) - Convenient Progress
Monitor shows you the current optimization progress and status at
any time:
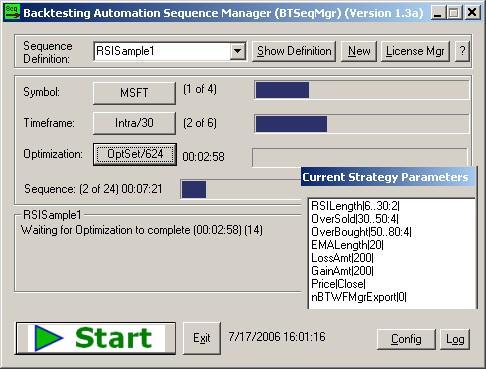
- Shows you the current symbol (MSFT the first of 4)
(click the button and see the list of pending symbols)
- Shows you the current timeframe (Intraday 30 Minute charts, 2 of 6 frames)
(click the button and see the list of pending timeframes)
- Shows you the current Optimization Parameter Set (OptSet with 624 permutations)
(click the button and see the list of all startegy parameters - as shown here)
- Shows overall sequence state (2 of 24 = 4 symbols x 6 timeframes)
- Shows time the current Optimization is running (00:02:58)
- Shows the overall running time: 7 minutes 21 seconds (00:07:21) - Customize any of the
details of the backtesting sequence
using the inbuilt script editor interface
which allows you also MULTI DATA STREAM CHARTS (just check Multiple Datastreams)
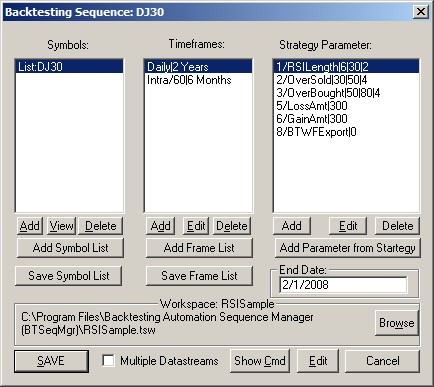
or edit the script directly using the advanced definition language - here is an example
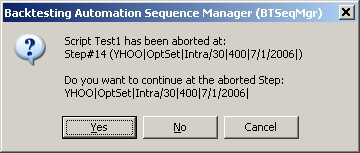
- Smart Abort Manager
allows you to easily abort of the optimization (to free up your computer);
but keeping track, were you stopped, so you can restart at the step you left off:
- Can optimize tick charts
based on daily volume - you just specify tick bars per day
- The easy interface helps
you define all backtesting sequence details
- Detailed log file of each
sequence
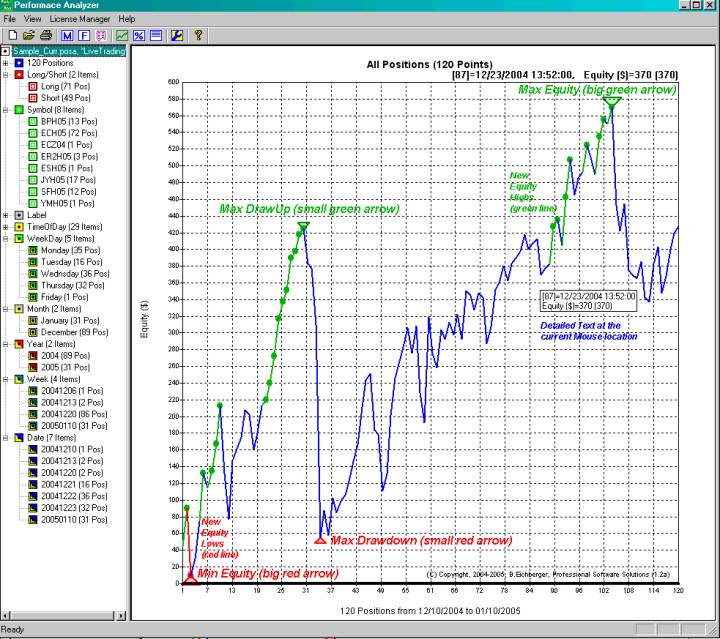
Trading Performance Analyzer
http://www.profsoftware.com/tsadd/perfana
The "Trading
Performance Analyzer" module assists you in
analyzing in depth your trading performance of:
- Your actual trading records (Instructions how
to import from TradeStation)
- Strategy backtesting results (Instructions how to
import your strategy backtesting results).
- Manually add/modify/delete your positions (Instructions how
use the Position Manager)
- Custom Trading Records import (Instructions how to
import from custom Trading Records)
Click here for an Equity
Screen Sample and Performance
Comparison Screen Sample.
Other Indicators and Products
Pivot Pattern Recognition Engine
http://www.profsoftware.com/tsadd/prod.htm#PPRE
Advanced ZigZag Line Indicator
http://www.profsoftware.com/tsadd/prod.htm#ZZ
Buy/Sell Pressure Indicator
http://www.profsoftware.com/tsadd/prod.htm#BSP
Rapid Response Smooth Average
http://www.profsoftware.com/tsadd/prod.htm#RareAvg
Trend Reversal and Strength Indicator
http://www.profsoftware.com/tsadd/prod.htm#TrendRev
Robust Regression System
http://www.profsoftware.com/tsadd/prod.htm#RRS
Advanced Normalized Momentum Indicator
http://www.profsoftware.com/tsadd/prod.htm#Mom
Identify best Trading Opportunities-TradingGems
http://www.profsoftware.com/tsadd/prod.htm#FindGem
Bar Countdown Utility
http://www.profsoftware.com/tsadd/prod.htm#Countdown
Export any Tradestation Data to your Spreadsheet
http://www.profsoftware.com/tsadd/prod.htm#Export
TradeStation Consulting and Products
http://www.profsoftware.com/tsadd
Powerfull set of UNIX and other utilities
http://www.profsoftware.com/unixdos
Database and XML Toolkit
http://www.profsoftware.com/dbtkxml
Internet Connection Monitor
http://www.profsoftware.com/intcomon
Disclaimer
The performance of the
“Universal Trend Detection (UNITRDES)” is based on hypothetical trading
performance information. With respect to such performance, please note the
following: Hypothetical or simulated performance results have certain inherent
limitations. Simulated trading programs in general are also subject to the fact
that they are designed with the benefit of hindsight. No representation is
being made that an account will or is likely to achieve profits. Trading in the futures and commodities
markets involves substantial risk and YOU CAN LOSE A LOT OF MONEY, and thus is
not appropriate for everyone. You should carefully consider your financial
condition before trading in these markets, and only risk capital should be
used.
Non-Disclosure and Disclaimer Statement:
The “Universal Trend Detection (UNITRDES)” from “Professional Software
Solutions (PSS)” are speculative trading techniques designed to buy and sell
automatically or assist you in discretionary trading.. No claims as to past,
present or future profitability of these services or other PSS methods are
made, and there is no guarantee that the system will provide any profits to
traders using the system, and indeed may cause such traders to incur losses.
All signal alerts generated are provided for educational purposes only. Any
trades placed upon reliance on UNITRDES are taken at your own risk for your own
account. Past performance is no guarantee of future results. While there is
great potential for reward when trading commodity futures, there is also
substantial risk of loss in all trading. You must decide your own suitability
to trade. Future trading results can never be guaranteed. This is not an offer
to buy or sell futures, stocks, ETF’s, FOREX, options or commodity interests.
Traders assume full liability for all trading risks and outcomes.
PSS or its employees and associates are not responsible for ANY loss or profit.
We make no performance claims of any kind. You hereby agree to all terms on
this page before you use UNITRDES, or any derivate, any service provided by
PSS.
Disclaimer
The UNITRDES system
from PSS generate trading signals and is not investment advice. We have no
financial interest in the outcome of any trades. There is substantial risk of
loss trading stocks, futures, FOREX, options and commodities. You need to
determine your own suitability to trade them. There may be tax consequences for
short term profits/loss on trades. Consult your tax advisor for details on this
if applicable.
Commodity Futures Trading Commission and Other Disclaimers
Neither PSS, not its
principals, officers or employees are CTAs. Trading any of the UNITRDES
system's signals presumes you have fully read and understood the risks involved
in trading stock, futures/commodities as set forth below:
Additional Notices
There are no guarantees or certainties in trading. Reliability of trading
signals for mechanical systems is in probabilities only. Trading involves hard
work, risk, discipline and the ability to follow rules and trade through any
tough periods during a system draw-downs. If you are looking for guarantees,
trading is not for you. Most people
lose in trading. One of the reasons is that they lack discipline and are unable
to be consistent. A system can help you become consistent. The ability to be
disciplined and take the trades is equally as important as any technical
indicators a trader uses. Ironically, worrying about the money aspect of trades
can contribute to and cause a trader to make trading errors. Therefore, it is
important to only trade with true risk capital.
ALL THE INFORMATION, SOFTWARE, CONTENT, PRODUCTS AND SERVICES AT PSS ARE
PROVIDED ON AN "AS-IS" AND "AS-AVAILABLE" BASIS, WITH NO
WARRANTIES OF ANY KIND. PSS EXPRESSLY DISCLAIMS ANY AND ALL WARRANTIES, EXPRESS
OR IMPLIED, INCLUDING WITHOUT LIMITATION WARRANTIES OF MERCHANTABILITY, FITNESS
FOR A PARTICULAR PURPOSE, AND NONINFRINGEMENT. PSS DISCLAIMS ANY WARRANTY THAT
THE SITE WILL ALWAYS BE ACCESSIBLE OR OPERATIONAL, THAT THE INFORMATION
PROVIDED BY THE PRODUCT ACCURATE, RELIABLE OR CORRECT, AND THAT ANY ERRORS WILL
BE CORRECTED. YOU AGREE THAT, UNDER NO CIRCUMSTANCES AND TO THE FULLEST EXTENT
ALLOWED BY APPLICABLE LAW, PSS WILL NOT BE LIABLE FOR ANY AND ALL DAMAGES UNDER
ANY AND ALL THEORIES (INCLUDING CONTRACT, NEGLIGENCE, STRICT LIABILITY OR TORT)
ARISING OUT OF OR RELATING IN ANY WAY TO THIS AGREEMENT, THE CONTENT, INCLUDING
WITHOUT LIMITATION ANY PSS CONTENT OR THIRD PARTY CONTENT, THE SITE, YOUR USE
OR INABILITY TO USE THE SITE, OR ANY DECISION OR ACTION YOU MAKE IN CONNECTION
WITH THE SITE. YOU AGREE THAT, UNDER NO CIRCUMSTANCES AND TO THE FULLEST EXTENT
ALLOWED BY APPLICABLE LAW, THE MAXIMUM AGGREGATE LIABILITY, IF ANY, THAT PSS
MAY OWE TO YOU IN CONNECTION WITH THIS AGREEMENT, THE SITE, AND YOUR USE OF THE
SITE AND ITS CONTENT, SHALL NOT, UNDER ANY CIRCUMSTANCE OR THEORY OF LAW OR
RECOVERY, EXCEED $100. YOUR ONLY OTHER REMEDY FOR DISSATISFACTION WITH THE
UNITRDES PRODUCT IS TO STOP USING THE PRODUCT. CERTAIN STATE LAWS DO NOT ALLOW
LIMITATIONS ON IMPLIED WARRANTIES OR THE EXCLUSION OR LIMITATION OF CERTAIN
DAMAGES. IF THESE LAWS APPLY TO YOU, SOME OR ALL OF THE ABOVE DISCLAIMERS,
EXCLUSIONS, OR LIMITATIONS MAY NOT APPLY TO YOU, AND YOU MIGHT HAVE ADDITIONAL
RIGHTS.
Subscription Agreement
Subscribers agree to pay a monthly subscription fee and agree to the Terms of
Use of the PSS site. They govern use of our site by registered subscribers.
Once you authorize us to charge your credit card the monthly fee on our behalf
and you register with PSS (registration constitutes your agreement to this
Subscription Agreement and the Terms of Use), you will receive the registration
key for your subscription or renewal to initiate or extend the expiration date.
Canceling Your Subscription
Monthly subscription fees, which have been charged to your credit card in the
past will not be refunded to you, in whole or in part. PSS has the right to
cancel your subscription and terminate this agreement if you fail to observe
any provision of this Subscription Agreement or any of the Terms of Use of our
site. We also can cancel your subscription if authorized charges to your credit
card are not honored, or if PSS is no longer authorized to charge your credit
card. Upon cancellation, you will not receive a subscription extension key. PSS
will have no obligation to return any portion of the subscription fees you have
paid prior to cancellation.
Your Limited User License
No subscriber or other user is allowed to copy, sell, license, modify,
distribute, reproduce, transmit, publicly display, publicly perform, publish,
adapt, edit, create any of part of the UNITRDES software on our site or any
derivative works from or use the Site Content, in whole or in part, except as
is expressly authorized by this license.
Your Obligation to Indemnify Us
You agree to indemnify, defend and hold harmless PSS, and its officers,
directors, employees, agents, information providers and suppliers from and
against all claims, causes of action, suits, losses, expenses, damages and
costs, including reasonable attorney's fees, arising out of, in connection with
or relating to any violation by you of the Subscription Agreement or these
Terms of Use, including claims of infringement of intellectual property or
other third party rights, or otherwise, directly or indirectly resulting from
or attributable in any way to any access to, use of or posting of material or
content on the any site by you.
Other Terms, Conditions and Provisions
The Subscription Agreement and these Terms of Use together constitute an
additional agreement between you and PSS and the prior agreement between you
and PSS will remain in effect.
The Subscription Agreement and the limited license granted to you are personal
to you, and may not be assigned or transferred by you to anyone else. You also
agree that you will not allow anyone else to access the UNITRDES product using
the same CustomerID unless such other person has also registered as a
subscriber. You agree that you will be solely responsible for any liability
arising from any third party access to or use of the UNITRDES product that you
permit or facilitate.
This Agreement shall be governed by and construed in accordance with Hawaii
law, without regard to that state's choice of law rules. You agree that your
use of the site constitutes activity in Hawaii and for the purpose of
litigating any dispute arising under this Agreement, you agree that any action
commenced against PSS shall be commenced and maintained solely in a federal or
state court of competent subject matter jurisdiction within the jurisdiction of
the U.S. District Court for the Honolulu county of Hawaii. You also agree to
submit and consent to the personal jurisdiction and venue of any such court in
the event PSS commences an action against you.
If any term or provision of the Subscription Agreement or of these Terms of Use
is finally found by a court of competent jurisdiction to be void, invalid,
unenforceable or otherwise contrary to law, the remainder of the Subscription
Agreement or Terms of Use, as the case may be, that can be given effect without
such term or provision, shall be given full effect.
Any failure by PSS to enforce strict performance of any provision of the
Subscription Agreement or the Terms of Use will not constitute a waiver of its
right subsequently to enforce such provision or any other provision of the
Subscription Agreement or Terms of Use.
Trading Signals
I also acknowledge that PSS recommends and advises all its members track and
keep their own statistical results on trades and to develop an independent
understanding in accordance with this software and I take complete
responsibility for their trades and acknowledge and accept the risks associated
with trading.
How to Become
a Subscriber
Submit your order online with your CustomerID and pay a subscription fee. You
will receive a matching registration key via the email placing the order. You
promise to adhere to this agreements and will be legally obligated to observe
the terms and conditions of our Subscription Agreement and the Terms of Use of
the PSS site, which follow.