StockEagle Show Ticks ![]()
![]()
Sometimes it can be very helpfull to actually see the most recent ticks to detemine the
strength
of a new high or breakout, because the ticker quickly changes and you will not be able to
scroll back to previous ticks.
Enter your ticker symbol and press "Show Ticks".
StockEagle will then load all the ticks of today.
You can change the date to any range you want depending on the server.
StockEagle will retreve up to the last 30,000 ticks.
Once retrieved you can then easily navigate up and down using the UP and DOWN buttons.
Here is an example of MSFT on July 24th, 1998:
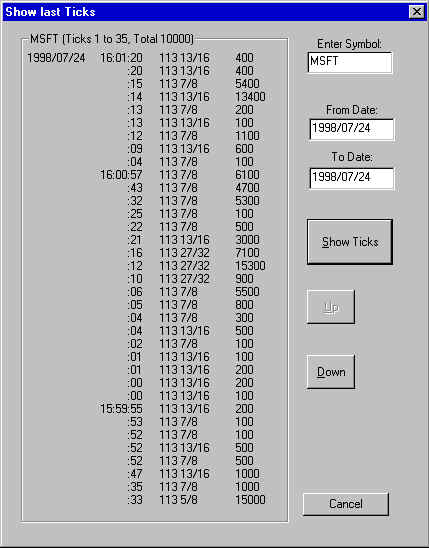
Note the date (1998/07/24) is only displayed once on the top and only again if the date changes.
Also the Minutes are displayed only once (16:01, 16:00, 15:59) when it changes,
while the seconds are displayed oin each line.
You can see the price and the volume of each trade.
As you scroll up and down using the UP and DOWN buttons the header will show you
the current range: SYM (Ticks xxx to yyy, Total zzz)