| Symbols: | Calc: | Cond: | Result: | DiagStart: |
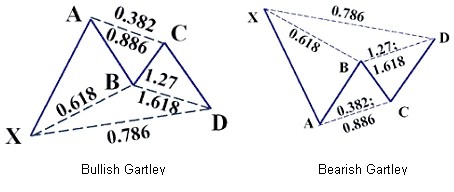
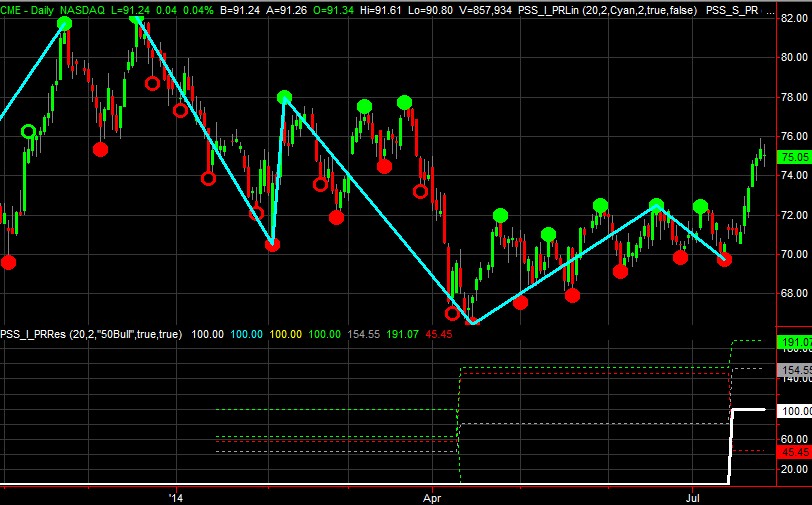
| XABCD Low |
DRatio1=BA/XA DRatio2=BC/BA DRatio3=DC/BC |
C1=DRatio1|50,78.6| C2=DRatio2|38.2,88.6| C3=DRatio3|127,161.8| |
AND=C1,C2,C3 | ;20030101 |
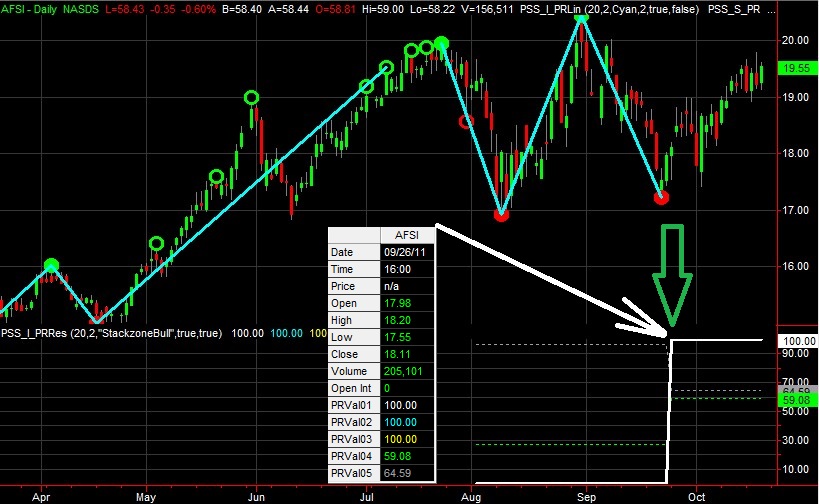
| 5 Points Wait for Low |
Define 3 Ratios | Define 3 Conditions | Define final Result | Optional diag start date |
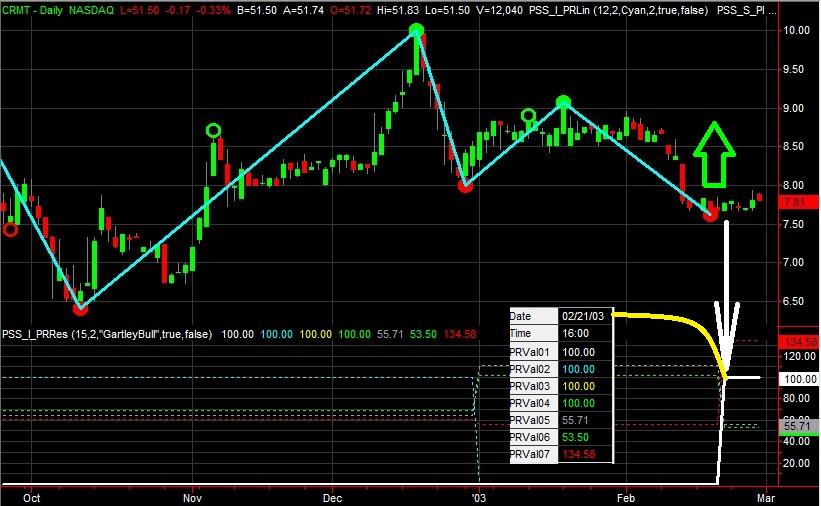
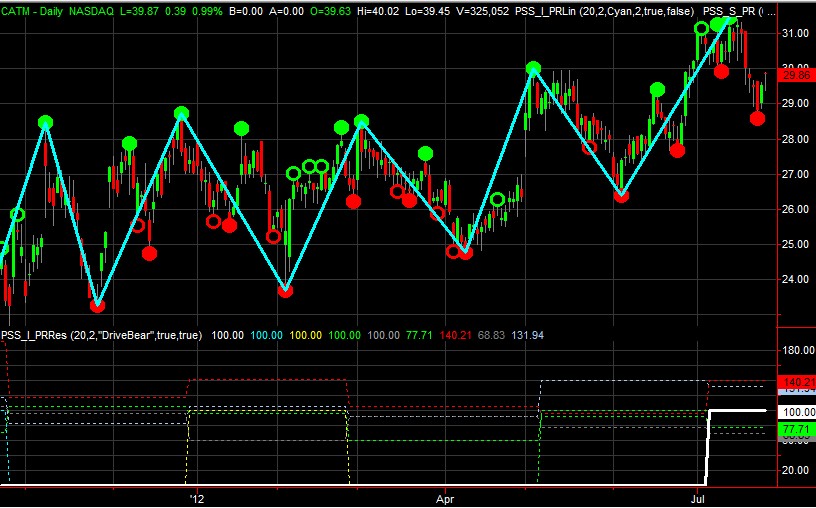
You can switch the detailed diagnostics on - by simply specifying a start date (Jan 1st, 2012) (remove the semicolon):
DiagStart:
20030101
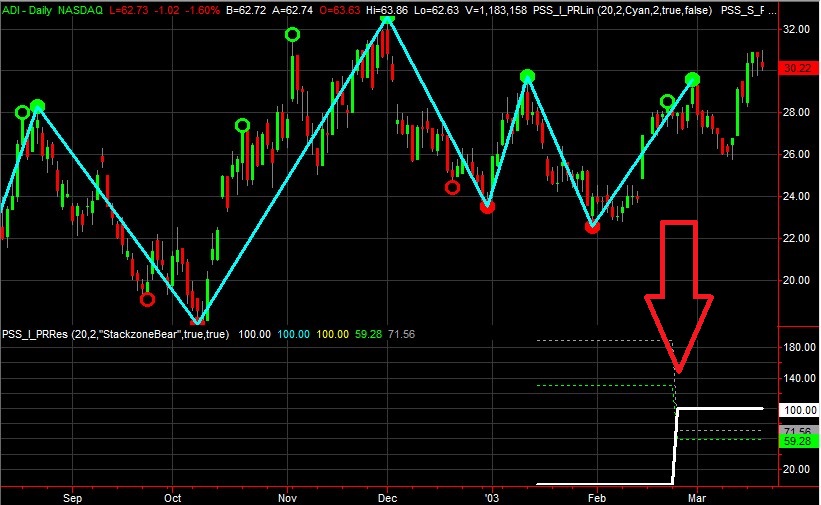
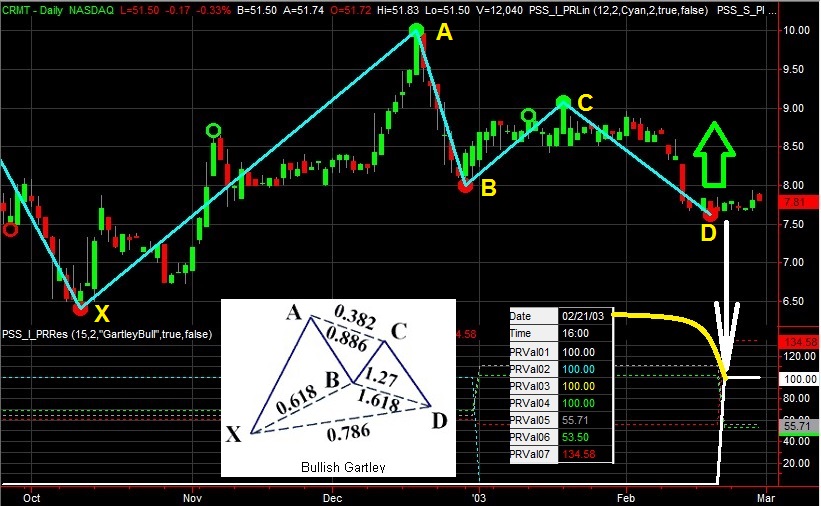
New Pivot detecetd:
When a new Pivot is detected - the engine shows in the log file the detailed diagnostics:
Diagnostics - Bar#708[02/21/2003 16:00]: O=7.6700, H=7.7800, L=7.6700, C=7.7700, Vol=31350 - 5 KeyPoints (Max 19):
List of Pivot Points:
PivotPt-X: Bar= 616, Prc= 6.4100, Dir=-1, Type=2, Exp=0, Show=0 (Bar#617[10/10/2002 16:00]: O=6.5000, H= 6.7300, L=6.4100, C=6.6300, Vol=66750)
PivotPt-A: Bar= 664, Prc=10.0000, Dir=+1, Type=2, Exp=0, Show=0 (Bar#665[12/18/2002 16:00]: O=9.4300, H=10.0000, L=9.4300, C=9.9300, Vol=60750)
PivotPt-B: Bar= 671, Prc= 8.0000, Dir=-1, Type=2, Exp=0, Show=0 (Bar#672[12/30/2002 16:00]: O=8.1300, H= 8.4600, L=8.0000, C=8.4100, Vol=27450)
PivotPt-C: Bar= 685, Prc= 9.0700, Dir=+1, Type=2, Exp=0, Show=0 (Bar#686[01/21/2003 16:00]: O=8.6700, H= 9.0700, L=8.6700, C=9.0000, Vol=25950)
PivotPt-D: Bar= 705, Prc= 7.6300, Dir=-1, Type=2, Exp=0, Show=0 (Bar#706[02/19/2003 16:00]: O=7.7900, H= 7.7900, L=7.6300, C=7.6700, Vol=6975)
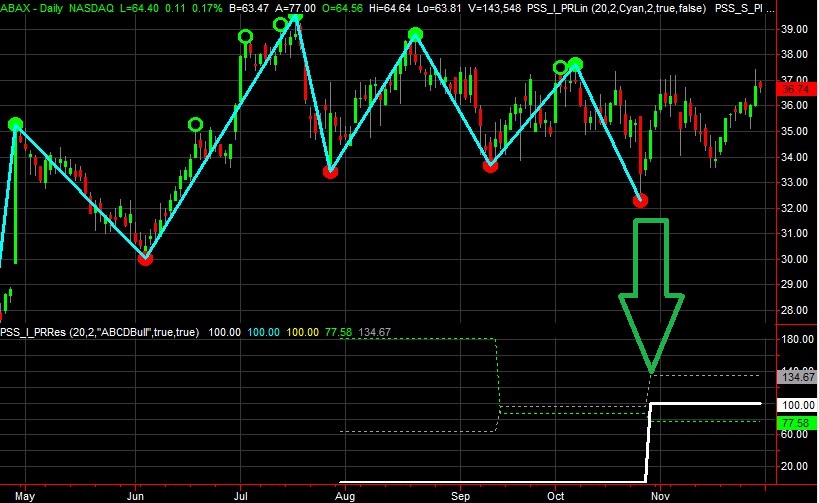
List of calculated Ratios:
Var=DRatio1 , Formula=BA/XA Res= 55.7103 Var1= 2.0000, Var2= 3.5900
Var=DRatio2 , Formula=BC/BA Res= 53.5000 Var1= 1.0700, Var2= 2.0000
Var=DRatio3 , Formula=DC/BC Res= 134.5794 Var1= 1.4400, Var2= 1.0700
List of Conditions check if in specified Range:
Cond: InRange : Var= 55.7103(DRatio1 ), Min= 50.0000, Max= 78.6000
Cond: InRange : Var= 53.5000(DRatio2 ), Min= 38.2000, Max= 88.6000
Cond: InRange : Var= 134.5794(DRatio3 ), Min= 127.0000, Max= 161.8000
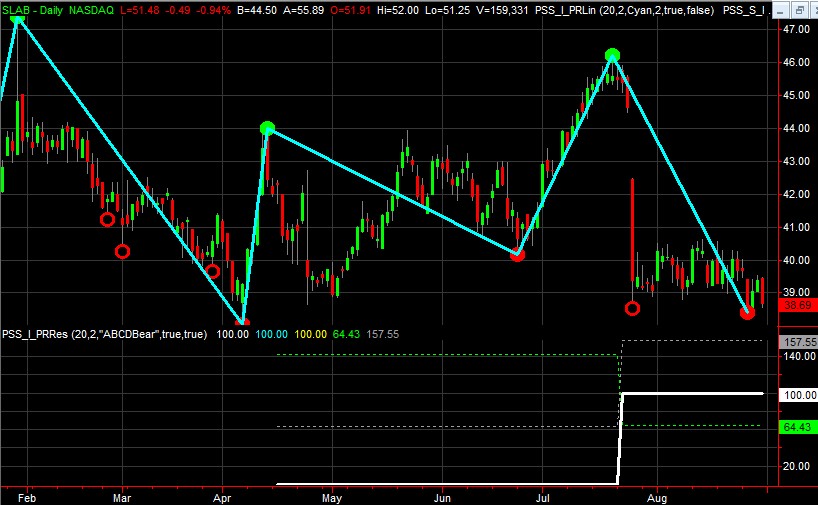
Final overall Result:
CalcPattern: Result=1, Type=A(And) Cnt=3(Max=3)