StockEagle Show Daily Graph ![]()
![]()
This function allows you to see instantly the daily graph of the selected symbol
for the last 60 days including the current day in progress while the market is active.
To activate this function simply click on the symbol in the study column
and select "Show Daily Graph" from the small popup menu:
You can also activate this graph function from the "Symbol Info/Show Graph"
function
To close this view hit the "Esc" button or click on the "X" in the
upper right hand corner.
Here is a sample screen for MSFT:
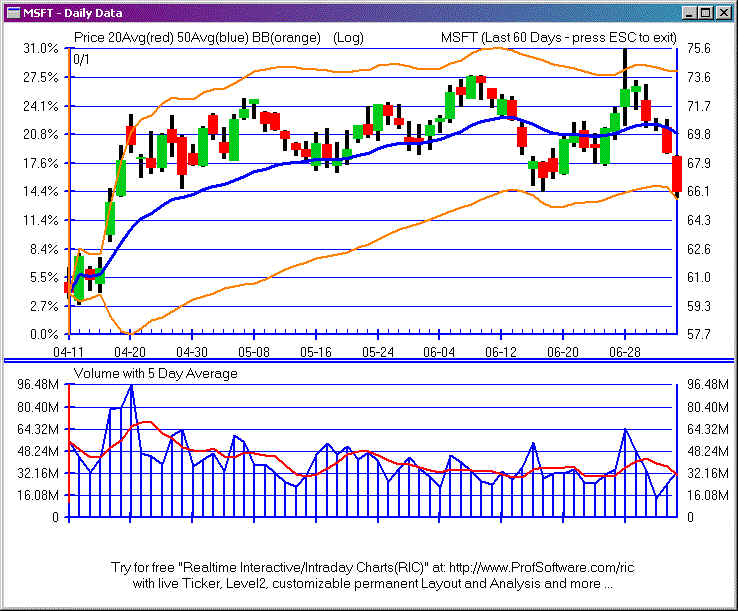
The blue Line indicates the 20 day moving average.
The orange lines above and below are the Bollinger Bands.
In the second window you see the daily volume with the 5 day moving average in red.
You can customize the layout and sgraph study by editing the DAY.win and DAY.def file.
For detailed intructions download the full Graph Module: "Realtime
Interactive/Intraday Charts(RIC)" at:
http://www.ProfSoftware.com/ric
This is a separate product with e free trial perido of 15 days allowing you to monitor
many different
stocks parallel with continuous ticker window and Level2 and much more...