Trading Performance
Analyzer (TrdPerfAna)
(Professional Software Solutions)
The "Trading Performance Analyzer" module allows
you to visualize and analyze in depth your trading performance!
- View your trades as an intuitive equity chart -
per trade or summarized as daily, weekly, monthly or Weekday result
- Export your trading records to a spreadsheet
- View detailed statistics - separated by a)
All trades b) Long only c) Short only!
- Add optional trend line and Bollinger
Bands to the equity chart
- Merge several results into one new
chart/result
- Import all your trades directly from
Interactive Broker (IB) using Reports or real-time Trader Log
- Import all your trades directly from
TradeStation using TradeManager or Strategy Reports
- Strategy backtesting results (Instructions how to import
your strategy backtesting results).
- Manually add/modify/delete your positions (Instructions how
use the Position Manager)
- Custom Trading Records import (Instructions how to
import from custom Trading Records)
Click here for an Equity Screen Sample and Performance
Comparison Screen Sample.
Download this videoTrading Performance
Analyzer (TrdPerfAna)
Functions:
_____________________________________________________________________________
Intuitive Equity Chart:
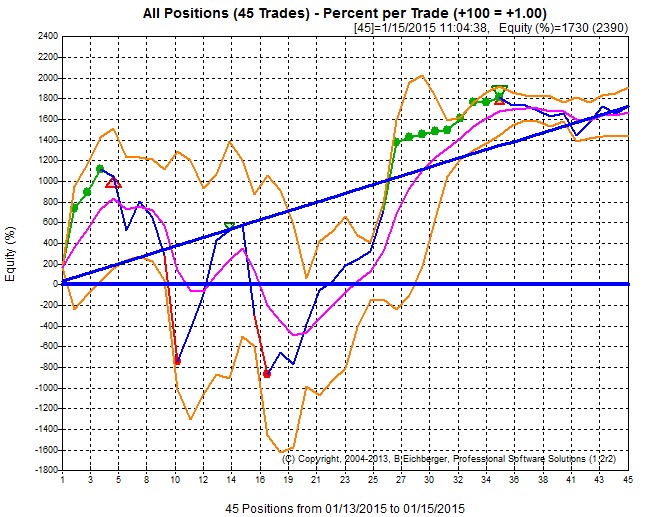
- Equity Bollinger Bands (orange line) (Bollinger standard Deviation
factor etc can be configured)
- Equity Average (magenta line)
- Trendline/Volatility reference line for volatility calculation (thick straight
blue line)
- intuitive tracking of
new and highest Equity highs/lows (green./red dots and triangles)
- mouse tracking showing details of each trade
- just click on the toolbar button  - to rotate through all the display modes below:
Equity($) Amount Chart with Trend Line only:
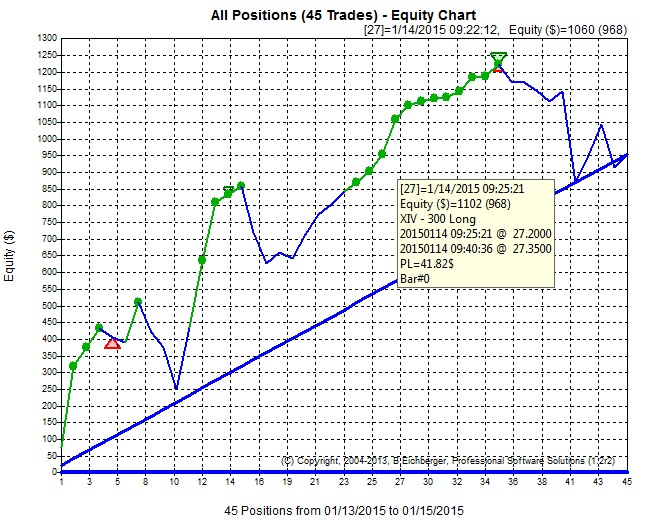
|
Equity($) Amount Chart with Bollinger Band and Trendline:
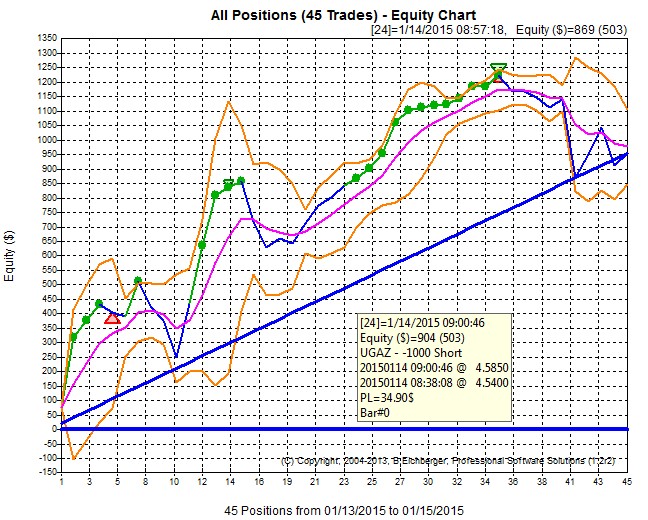 |
Equity($) Amount Chart with Bollinger Bands only:
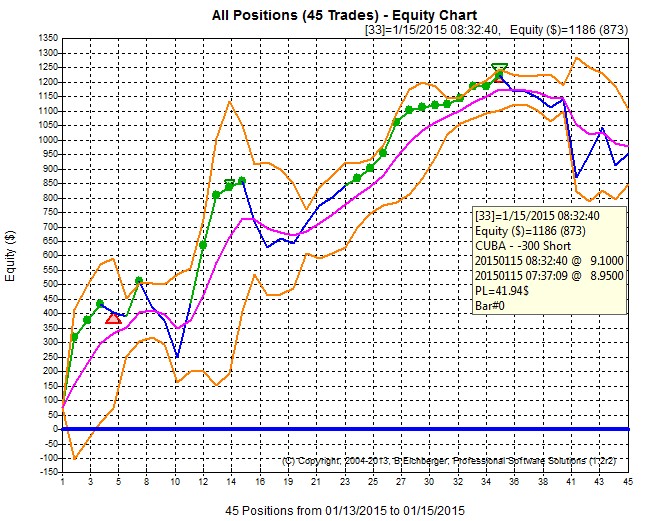
|
Plain($) Amount Equity Chart:
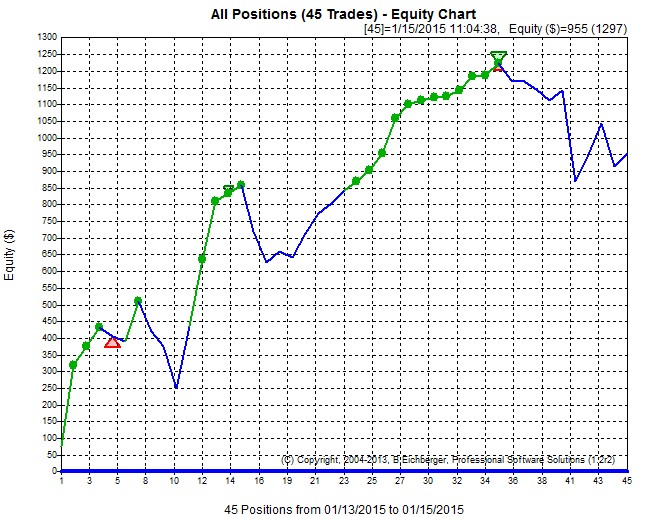 |
_____________________________________________________________________________
Intuitive Drawdown Chart:
You can switch to the drawdown chart - just click the  button in the toolbar:
Drawdown - shown as percent from last top:
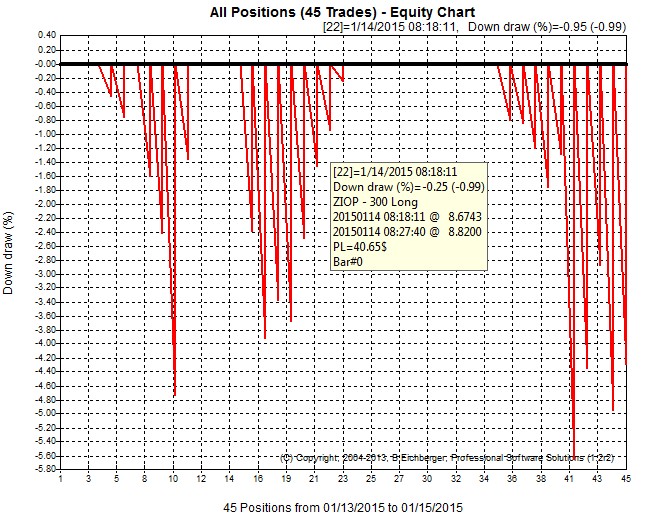
|
Drawdown - shown as Amount($) from last top:
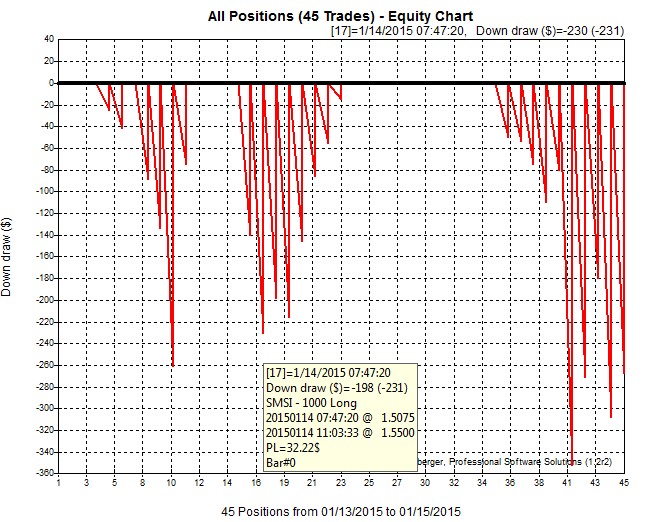
|
_____________________________________________________________________________
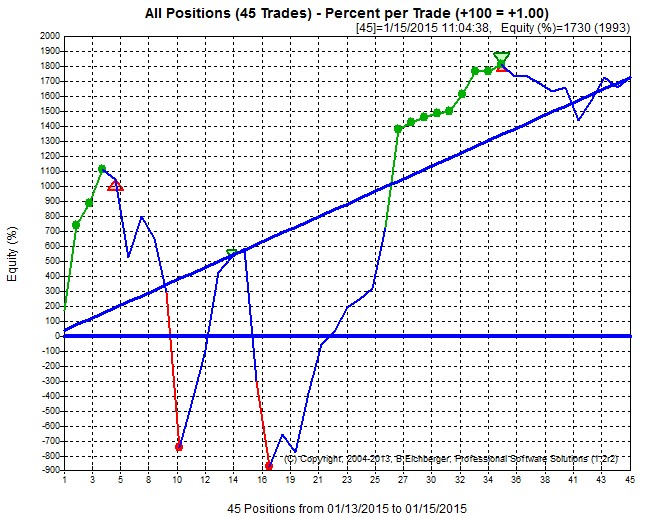
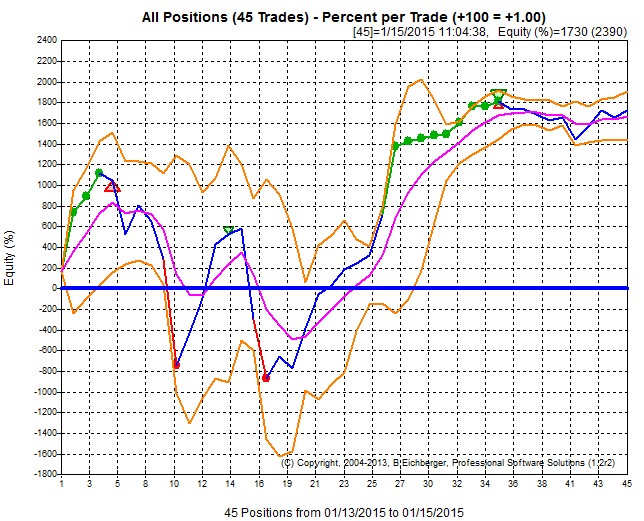
Intuitive Equity(%) Percent Chart:
It can be very helpful to view the performance and each trade as a percent
value(100=1%) - instead of the actual trading Profit/Loss Amount($),
because small winners might be actually big percent winners, and also big amount
loosers might be small percent loosers!
In the example below - the small amount looser(Pos#16, -$140.03) was actually
pretty big percent looser (9.72%)
- Equity Bollinger Bands (orange line) (Bollinger standard Deviation
factor etc can be configured)
- Equity Average (magenta line)
- Trendline/Volatility reference line for volatility calculation (thick straight
blue line)
- intuitive tracking of
new and highest Equity highs/lows (green./red dots and triangles)
- mouse tracking showing details of each trade
- just click on the toolbar button
- to rotate through all the display modes below:
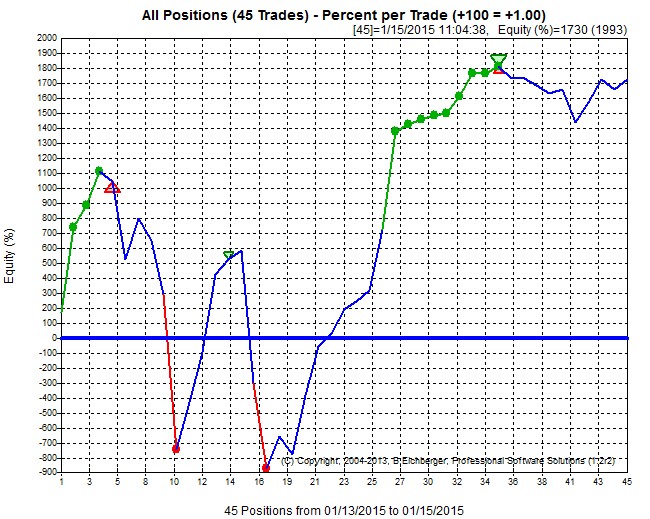
Equity(%) Percent Chart with Trend Line only:
|
Equity(%) Percent Chart with Bollinger Band and Trendline:
 |
Equity(%) Percent Chart with Bollinger Bands only:
 |
Plain(%) Percent Equity Chart:
 |
_____________________________________________________________________________
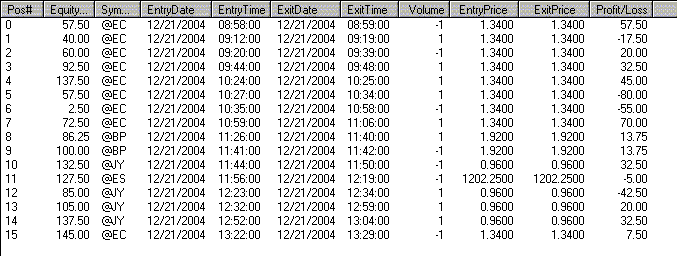
Advanced Position/Trade List
You can also view all position/trade detauils in the convenient Position List
Display:
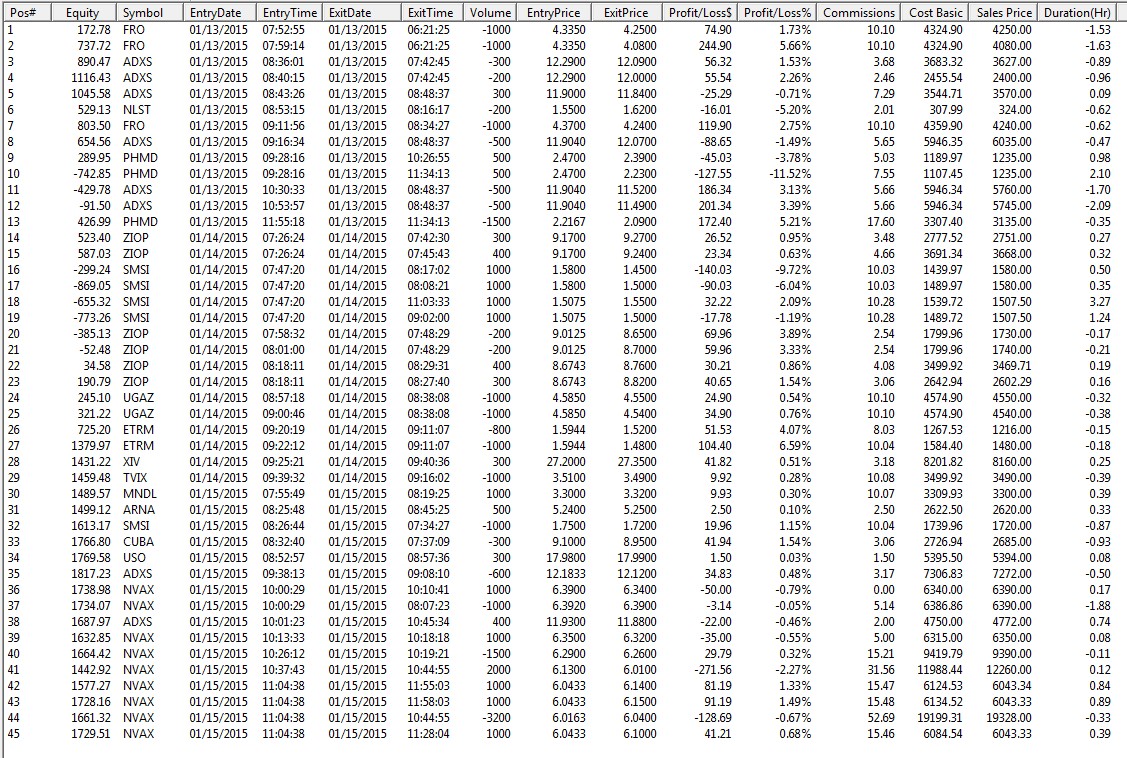
To open this display - just double click on the Position Label: 
_____________________________________________________________________________
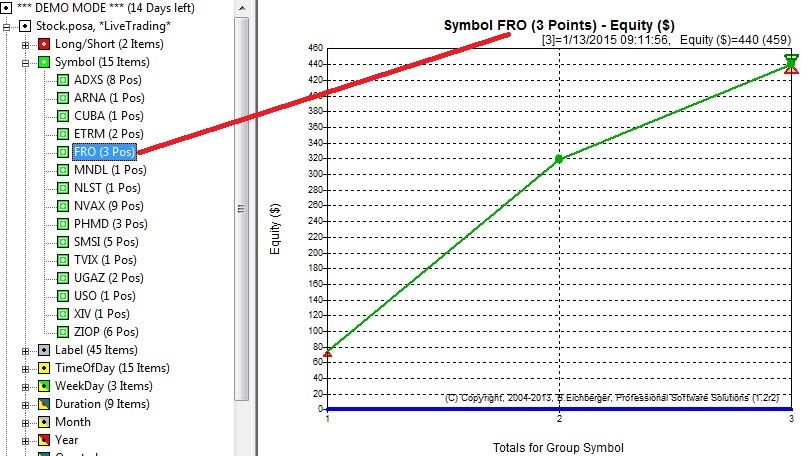
Performance per Symbol
To check the performance PER SYMBOL - just click on the symbol label:
"Symbol (X Items)"
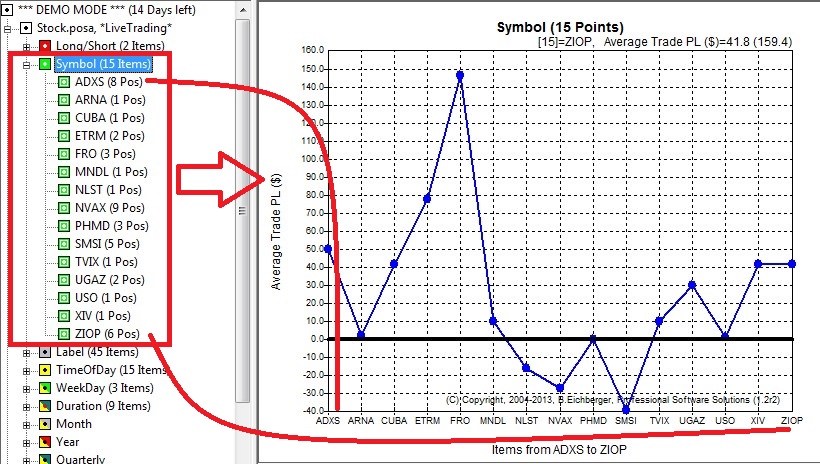
To see the performance($) and trades for EACH SYMBOL - just click on the symbol
itself:
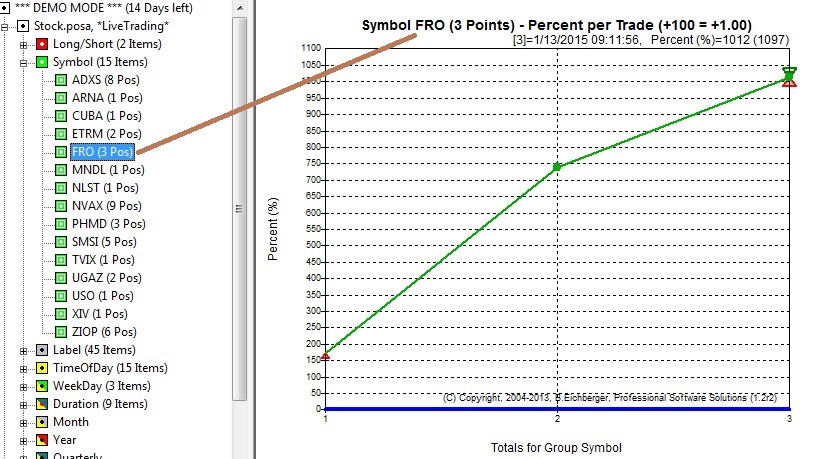
You can even switch to the percent style display for the selected symbol -
showing 10% gain for those 3 trades:
_____________________________________________________________________________
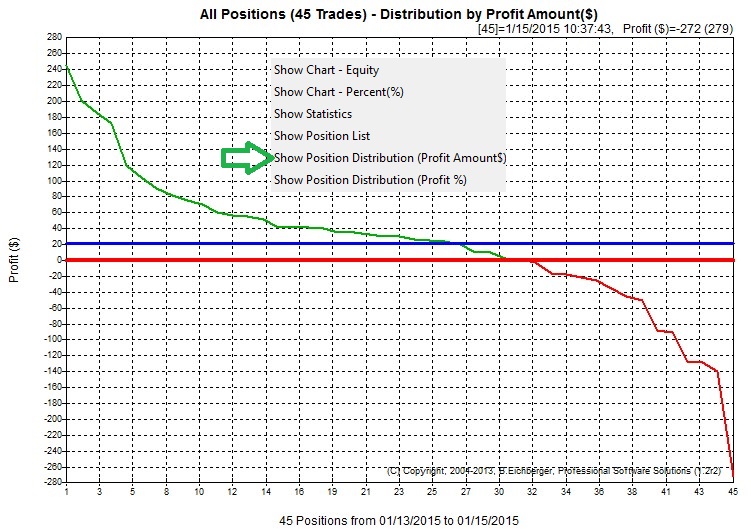
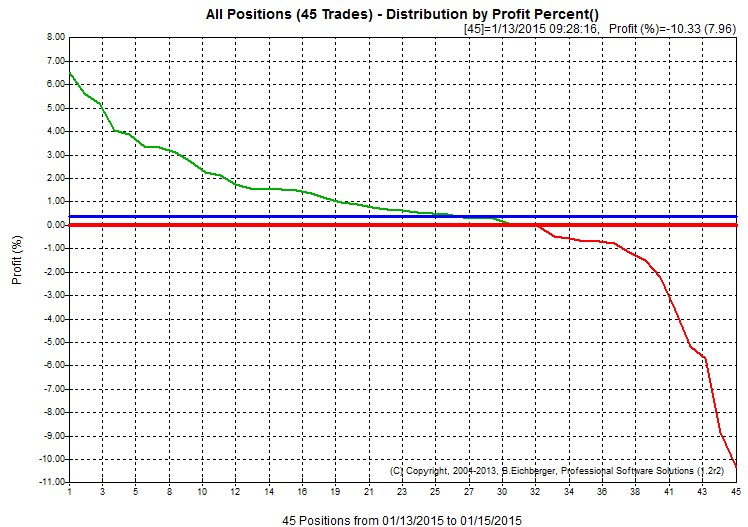
Performance Distribution
You can also order all positions/trades by their performance - instead of teh
default time based sort order!
Either using the PL Amount($) - showing in this example gains between $240 and
losses -$280 - per trade:
or using the PL Percent(%) - showing in this example gains between 6.2% and
losses 10.5% - per trade:f
_____________________________________________________________________________
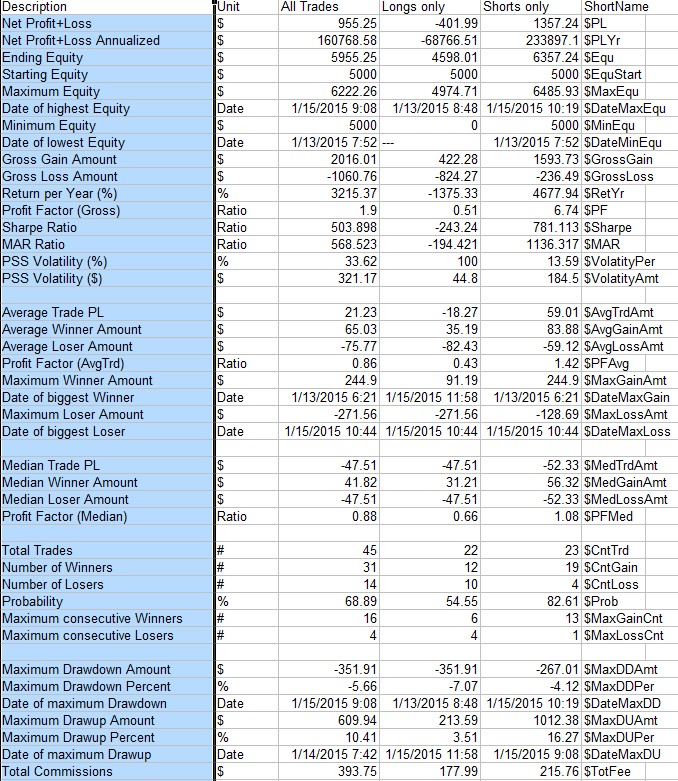
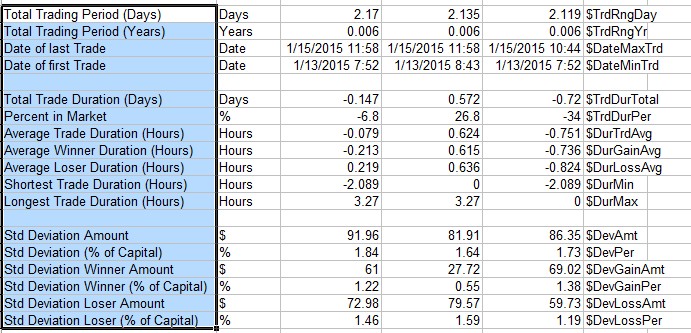
Advanced Statistics
You can create an advanced statistics overview of the performance - and export
to a spreadsheet or PDF
_____________________________________________________________________________
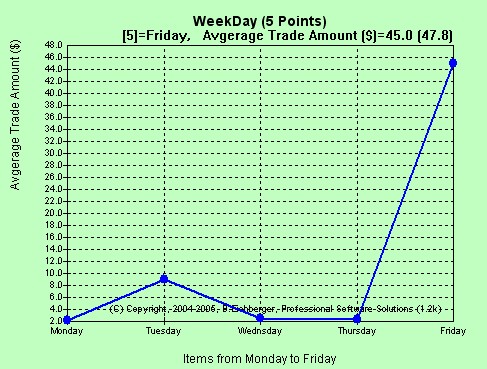
Analyze your
Performance grouped any of the following criteria
- Direction (Long/Short)
- Symbols/Markets
- Time of Day buckets (15 Min Interval - can be configured to for
example 60 minutes, creating hourly buckets)
- Weekdays (Monday, Tuesday etc) - Example below:
- Year, Month, Days
- Strategy Exit Labels or Accounts (LiveTrading)
- Monte Carlo Performance Analysis
Detailed Statistical Analysis
of your Performance calculating more than 50 parameter
separated in three columns: All, Long and short positions.
Filter out current
Positions based on many criterias
This functions allows you to "zoom in" to custom sub sets
you specify;
then you can analyze the subset and also save the new selection as a new
file.
To start the filter: Click on File/Filter or click on  in the Toolbar.
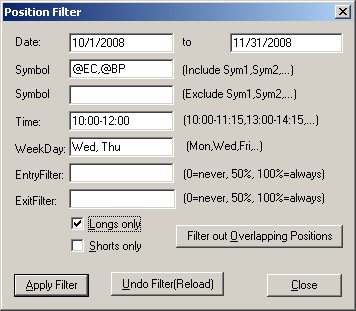
In this example we select the following Positions:
- Entry date between Oct 1st, 2004 and Nov 31st, 2004
- Only symbol @EC, @BP
- Entry time of day between 10:00 and 12:00
- Only Wednsday and Thursday trades
To undo all filter click on the "Undo Filter/Relaod"
button
Filter out overlapping Positions
You can even filter out overlapping positions from a reference set.
Just click on the "Filter out Overlapping Positions" button
and select your reference position file.
Then you receive automatically a detailed spreadsheet and the
overlapping positions filtered out
Detailed Statistical Analysis
of your Performance calculating more than 50 parameter
separated in three columns: All, Long and short positions. |
Now you can also Merge several Strategy Backtesting
Results from different Markets
into ONE single continuous Performance Report.
Click on File/Merge or the  in the Toolbar and select the file to merge into the current set.- OR
-
in the Toolbar and select the file to merge into the current set.- OR
-
You can also drag-and-drop one (or several files) into the current set to
merge.
Click here for instructions on how to save Live Trading or
Strategy backtesting results. |
Generates a comprehensive
Analysis Overview
with all performance details for all the various groups.
Click on File/Overview or on the  in the Toolbar
and automatically a new web page is generated for you, you can then
print, save or share. |
Displays comprehensive trade list sorted by date for each
of the many groups and sub sections:
In this example we show onlythe Tuesday Positions:
 |
Configure your preferences:
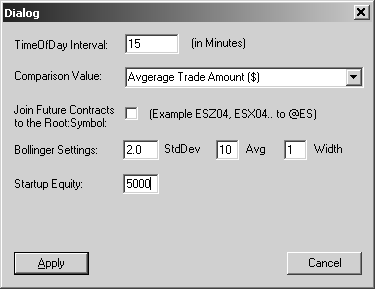
The following elements can be configured:
| Time of Day Interval |
Here you can change the default TimeOfDay interval
(default 15 Minutes)
For example 60 minutes compares the performance grouped by the
hour |
| Compare Value |
Here you also define the statistical parameter to be
used
when you compare the various group totals. |
| Root Join |
Future contracts change every quarter, creating
new/separate symbols;
this function allows you to "join" all the different
contract for the same
root symbol into ONE continuous symbol:
Example: ECH05, ECZ04 etc is joined to @EC
(Note that the original data is not changed unless you save and
overwrite the original file!) |
| Bollinger Settings |
Here you define the Bollinger settings:
| StdDev(2.0) |
Standard Deviations (Default is 2.0) |
| Avg(10) |
Moving Average (Deafult 10 points) 0 will
disable the bollinger feature |
| Width(1) |
Thickness in pixels of the bollinger band |
|
| Startup Equity |
Defines the initial Equity - used to calculate the
RateOfReturn, Drawdown Percent etc |
|
The Zoom in feature allows you to
magnify a particular date range
a) left click to the left starting point in the chart and keep the left
mouse button clicked
b) move to the right ending point in the chart and let go of the mouse
button
c) the selected area will now be displayed
d) To "unZoom" - select only less than 3 points as described
above |
By default only days with at least one
position are listed in the "Days" section.
With the "Fill in missing Trading Days" function
you can add all the days without
any trading, so that you can then get a complete calendar equity graph,
also showing the "days off":
 |
| Custom Trading Records
import (Instructions how to
import from custom Trading Records) |
|
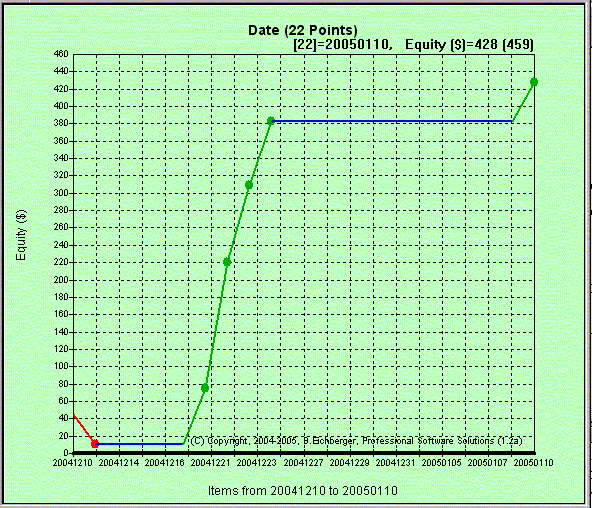
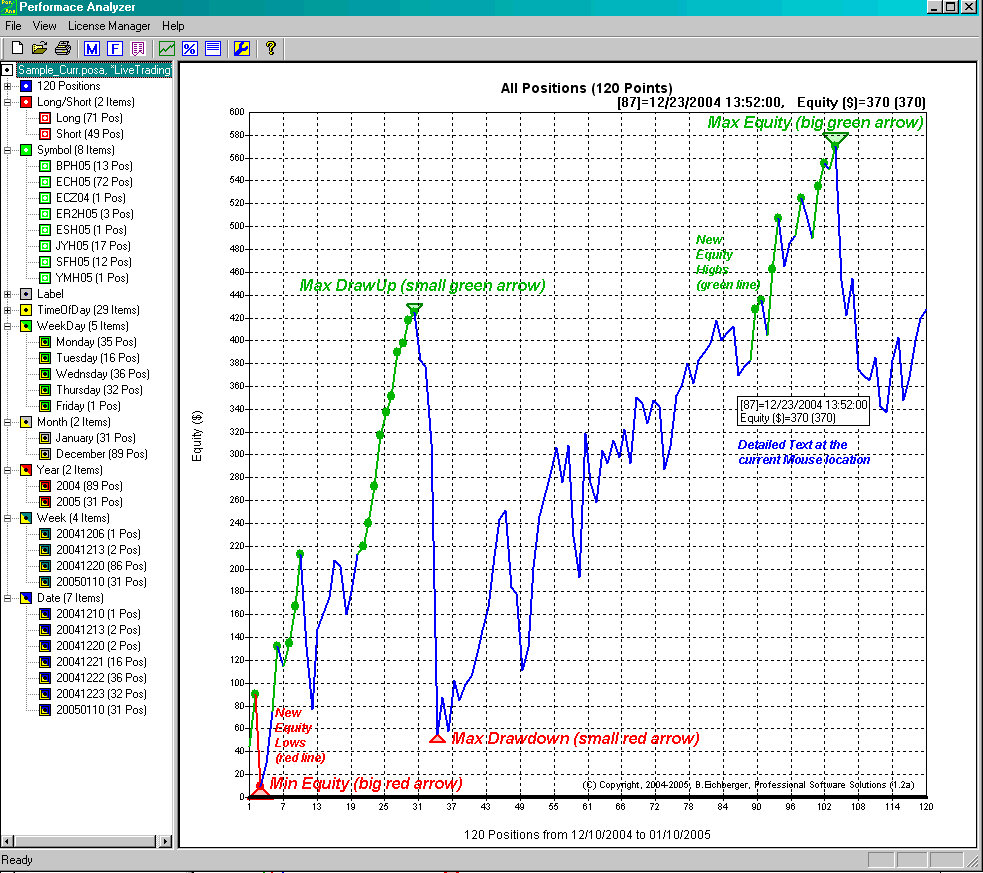
Screen Sample1 (Main
Equity Chart)
This chart shows your Equity graph of all positions in date sequence:
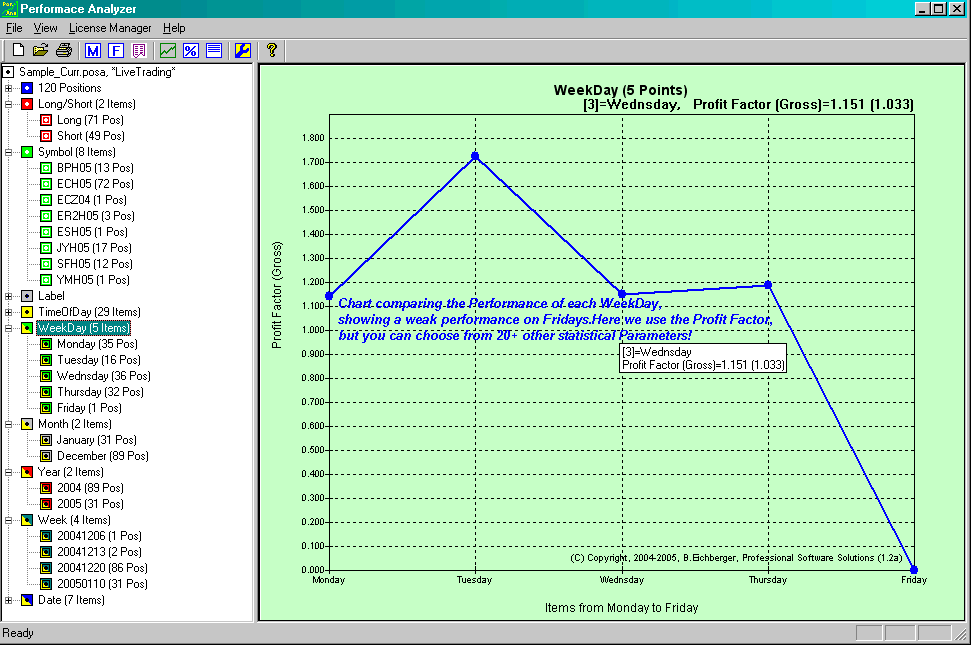
Screen Sample
(Performance Comparison)
This chart shows the comparison of the performance of positions grouped by
weekdays,
indicating in this example a weak Friday performance. In this sample the
"Profit Factor(Gross)"
has been used, choose from over 20 other statistical parameters:
The following statistical parameter are available for performance comparison:
| 1. |
Profit Factor (Gross) |
| 2. |
Avgerage Trade Amount |
| 3. |
Avgerage Winner Amount |
| 4. |
Avgerage Looser Amount |
| 5. |
Profit Factor (AvgTrd) |
| 6. |
Maximum Winner Amount |
| 7. |
Maximum Looser Amount |
| 8. |
Median Trade Amount |
| 9. |
Median Winner Amount |
| 10. |
Median Looser Amount |
| 11. |
Profit Factor (Median) |
| 12. |
Probability |
| 13. |
Average Trade Duration (Minutes) |
| 14. |
Average Winner Duration (Minutes) |
| 15. |
Average Looser Duration (Minutes) |
| 16. |
Longest Trade Duration (Minutes)" |
| 17. |
Shortest Trade Duration (Minutes) |
| 18. |
Std Deviation Trade Amount |
| 19. |
Std Deviation Winner Amount |
| 20. |
Std Deviation Looser Amount |
| 21. |
Std Deviation Trade Percent |
| 22. |
Std Deviation Winner Percent |
| 23. |
Std Deviation Looser Percent |
| |
|
| |
|
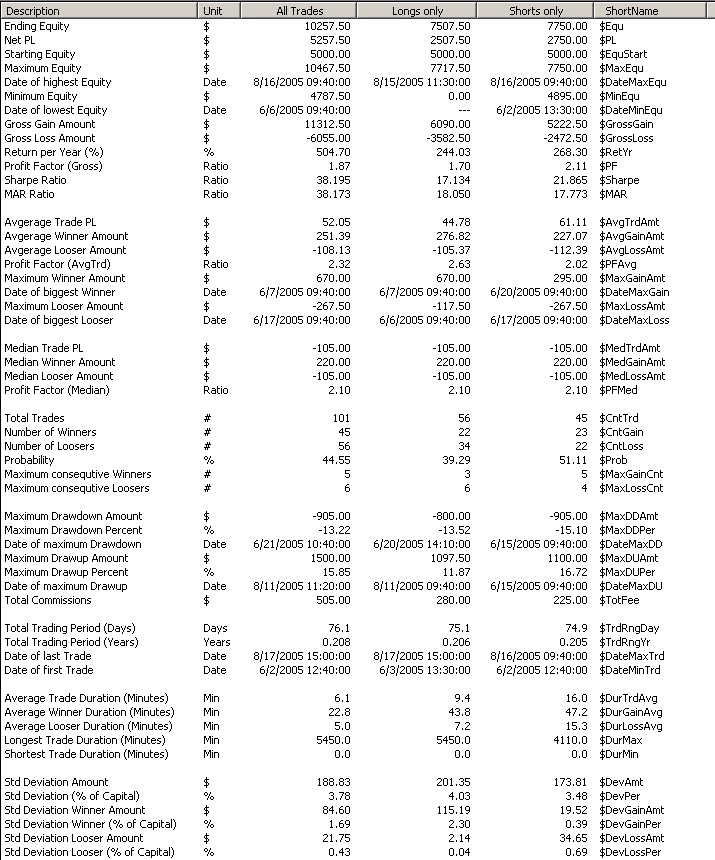
Screen Sample
(Statistical Analysis)
Below you can see a sample of our detailed statistical analysis:
© Copyright 2004-2015, Burkhard Eichberger,
Professional Software Solutions
All Rights Reserved Worldwide.