The following details are shown:
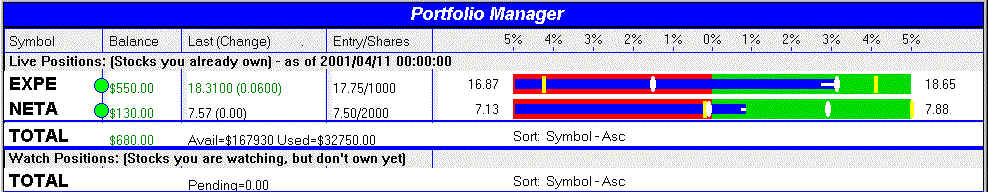
Below is an example Portfolio View with two positions:
The following details are shown:
| EXPE | Symbol |
| $550.00 | Profit/Loss |
| 18.31 | Last Trading Price |
| 0.06 | Last Change from previous price |
| 17.75 | Entry Price |
| /1000 | Number of shares bought |
| 16.87 | 5% Left side price within the Graph |
| 18.65 | 5% Right side price within the Graph |
The Blue line shows the current price visually.
The Yellow maarkers show the Day High/Low.
The small white bar within the blue line shows the current spread.