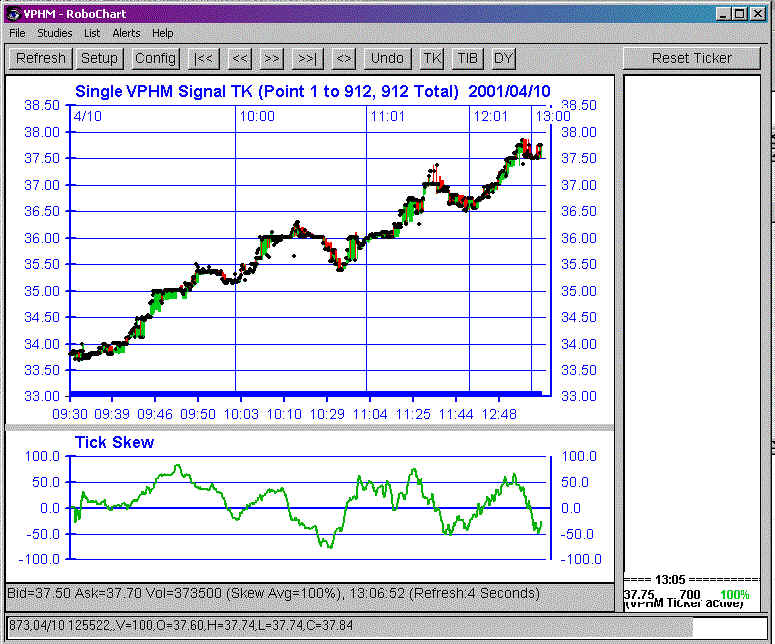
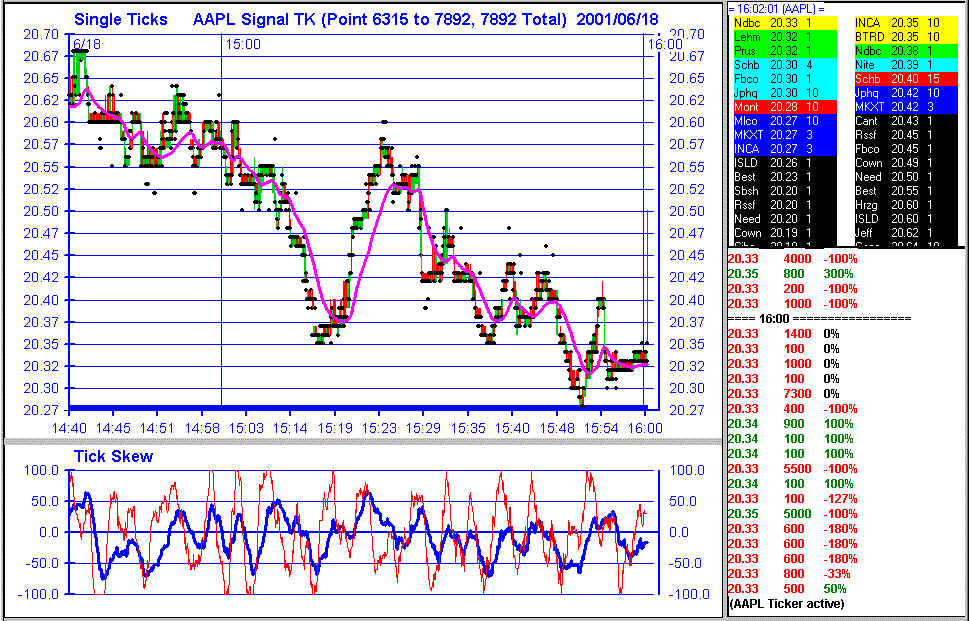
Below is a sample tick-by-tick charting window:
The charting can be of imense help when you develop trading
strategies.
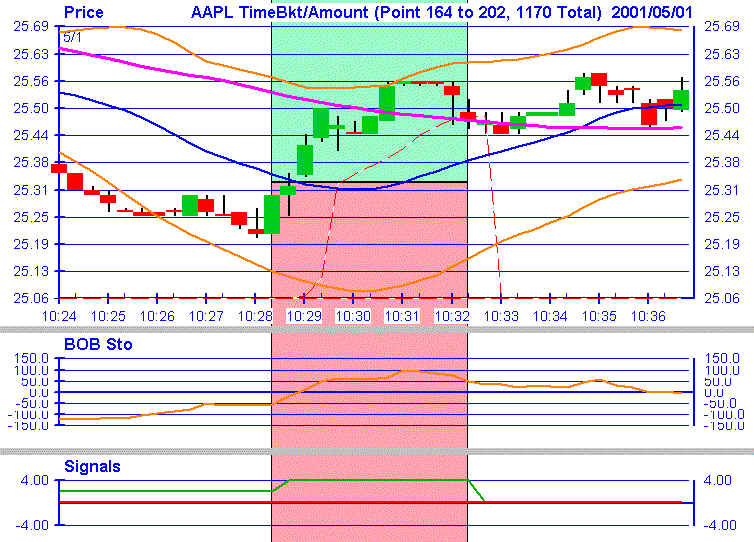
Below is a sample showing the 20 Second bar charts with and entry at 10:28:30 for 25.32$.
The green area is the profit range while the red/pink area is the loss range,
the red dotted line is the current dynamic Stop out/Gain line
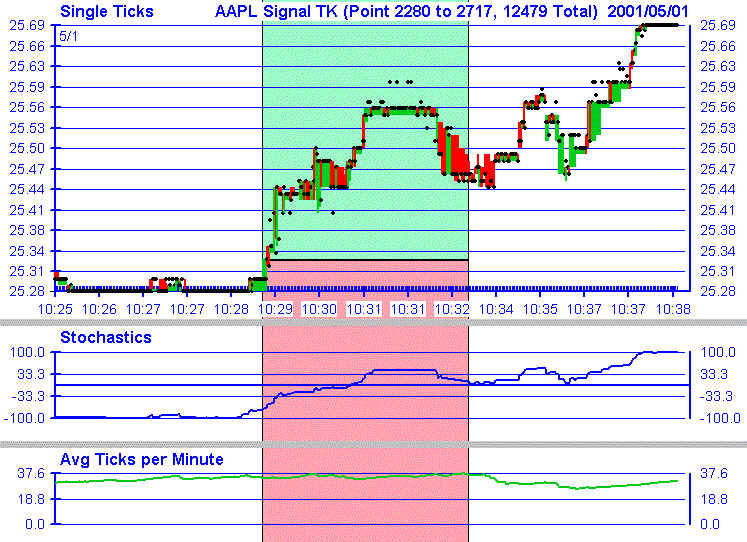
You can also view the results in the tick-by-tick view:
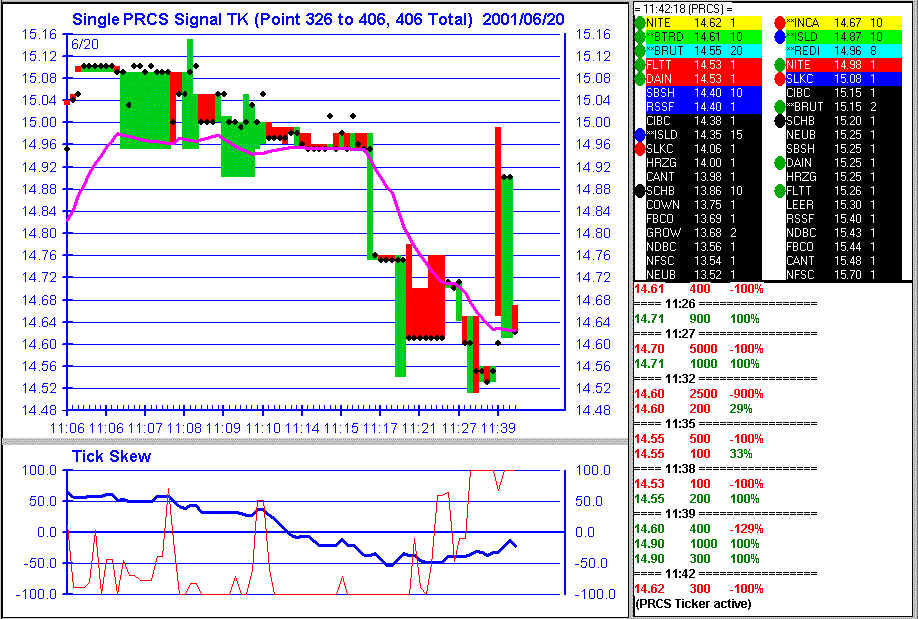
Multi Mark Level2 Display
RoboCha offers also a powerfull feature allowing you to mark specific ECN/MarketMaker
using 4 different colors.
In the example below the sellers (INCA, SLKC) are marked red,
the buyers (NITE, BTRD, BRUT, FLTT, DAIN) are marked green,
the neutrals (ISLD) are marked in blue
and extras (SCHB) are marked as black
RoboCha also can alert you when any offer within the top 4 bid/ask tiers change with a
sound you can assign.
RoboCha will remember all your Level2 Mark settings even when you exit
and restart for each symbol.
Ticker and Level2 Display
Of cause RoboCha is also able to display the last 100 ticks and the current Level2 Window:
RoboCha will even reload the last 100 ticks on startup, unlike RealTick which ONLY shows
the new incoming ticks!
Also you can choose if the new ticks appear at the bottom (RealTick) or Top!
Custom Layout
A whole layout language is available for you to define which studies in which combination
can be viewed:
In this example you can see the layout definition used in the picture above:
[Layout3]
NAME=Avg Ticks per Minute
1=SRC:8,TITLE:Single Ticks,Height:59,AXISY:GRID/FRAC,AXISX:SEQ,Color:CoGraph
2=SRC:12,TITLE:Stochastics,Height:22,AXISY:GRID/ZERO/MAX100/MIN-100,AXISX:NOXTXT/SKIP,Color:Blue,Pen:2
3=SRC:17,TITLE:Avg Ticks per
Minute,Height:19,AXISY:GRID/MIN0/GRTOG,AXISX:NOXTXT/SKIP,Color:Olive,Pen:2
[Layout4]
NAME=Stochastics
1=SRC:8,TITLE:Single Ticks,Height:73,AXISY:GRID/FRAC,AXISX:SEQ,Color:CoGraph
2=SRC:51,TITLE:Stochastics,Height:27,AXISY:GRID/ZERO/MAX100/MIN-100,AXISX:NOXTXT/SKIP,Color:Blue,Pen:2
21=SRC:91,WIN:1,Color:Magenta,Pen:3
22=SRC:95,WIN:1,Color:Blue,Pen:3
23=SRC:96,WIN:1,Color:Orange,Pen:3
24=SRC:52,WIN:2,Color:Orange,Pen:2
25=SRC:61,WIN:2,Color:Red,Pen:2
26=SRC:62,WIN:2,Color:Olive,Pen:2
Custom Data Calculations
A whole data caclulation language is available for you to define which studies should be
generated/calculated:
; ********************************
; ****** SCAN SETUP **************
; ********************************
Cache=10
; **** BASICS ****
101=SRC:6,TITLE:EMA 20 ,METHOD:EMA,STACK:20
102=SRC:6,TITLE:EMA 50 ,METHOD:EMA,STACK:50
103=SRC:6,TITLE:EMA 200 ,METHOD:EMA,STACK:200
104=SRC:5,TITLE:MA 5 ,METHOD:MA,STACK:5
105=SRC:5,TITLE:VOL HIGH,METHOD:HIGH,STACK:1
106=SRC:5,TITLE:VOL HIGH,METHOD:HIGH,STACK:100
107=SRC:5,TITLE:Recent Volume High %0H301% @ %1P301%,METHOD:DIV/105,MUL:100
108=SRC:5,TITLE:VOL HIST 100,METHOD:DIV/106,MUL:100
109=SRC:5,TITLE:VOL EMA100,METHOD:EMA,STACK:100
111=SRC:4 ,TITLE:EMA20 NORM,METHOD:DIV/101,MUL:100,ADD:-1
112=SRC:4 ,TITLE:EMA50 NORM,METHOD:DIV/102,MUL:100,ADD:-1
113=SRC:4 ,TITLE:EMA200NORM,METHOD:DIV/103,MUL:100,ADD:-1
114=SRC:101,TITLE:EMA20 TO 50,METHOD:DIV/102,MUL:300,ADD:-1