Try EB for free for 14 days on your computer - click here
For more details email to:
Eichberger Bands Sample Charts:
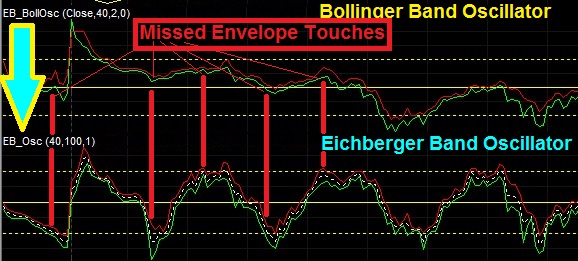
"Eichberger Bands" Oscillator
gives more significant signals:
Try EB for free for 14
days on your computer - click here
For more details email to: ![]()
Eichberger Bands Sample Charts:
| GMCR Stock 2Minute Intraday Sample Chart (EB1) |
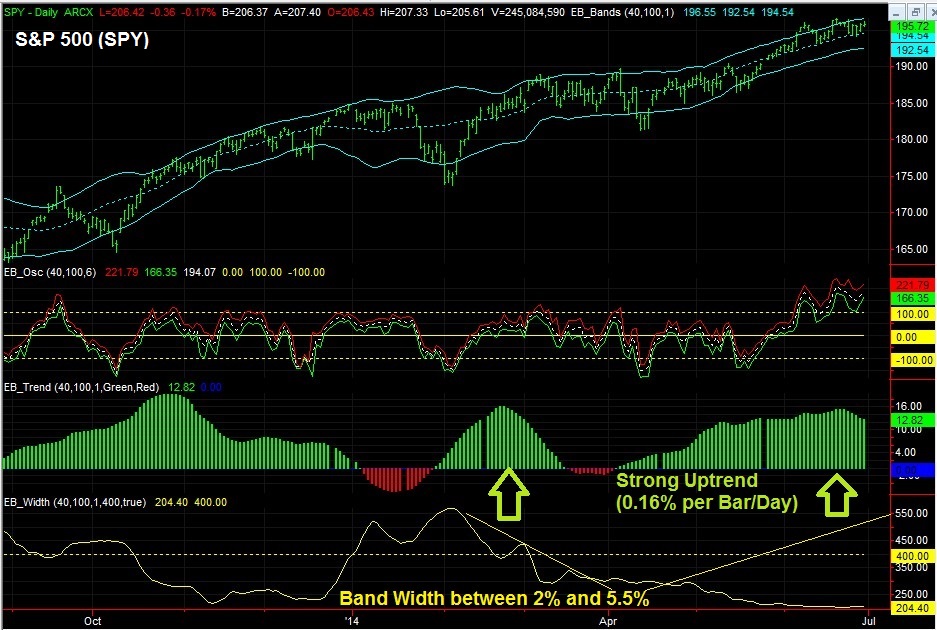
| SPY Stock Daily Sample Chart (EB2) |
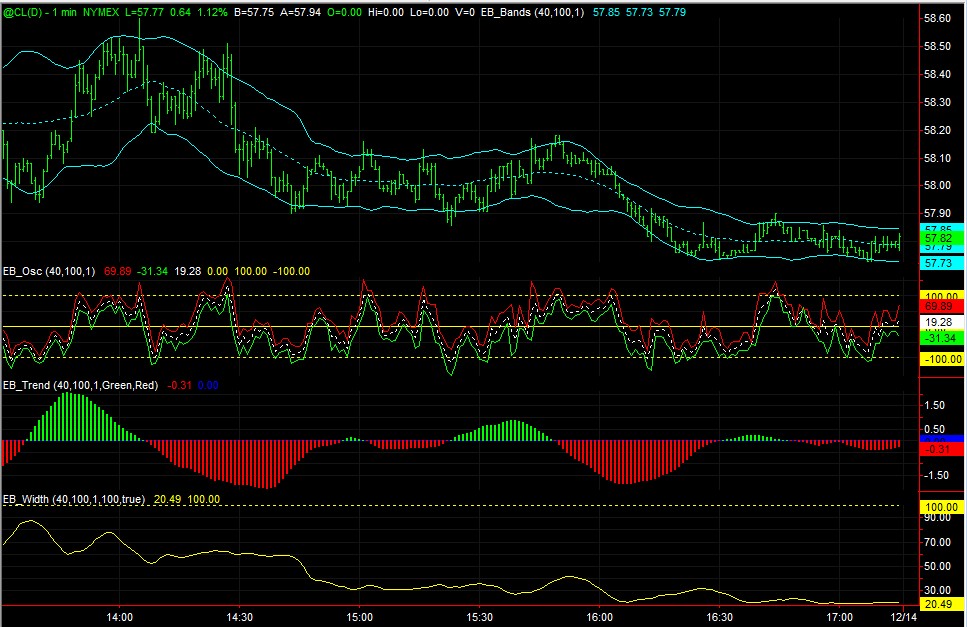
| Crude Oil(CL) Futures 1 Minute Intraday Sample (EB5) |
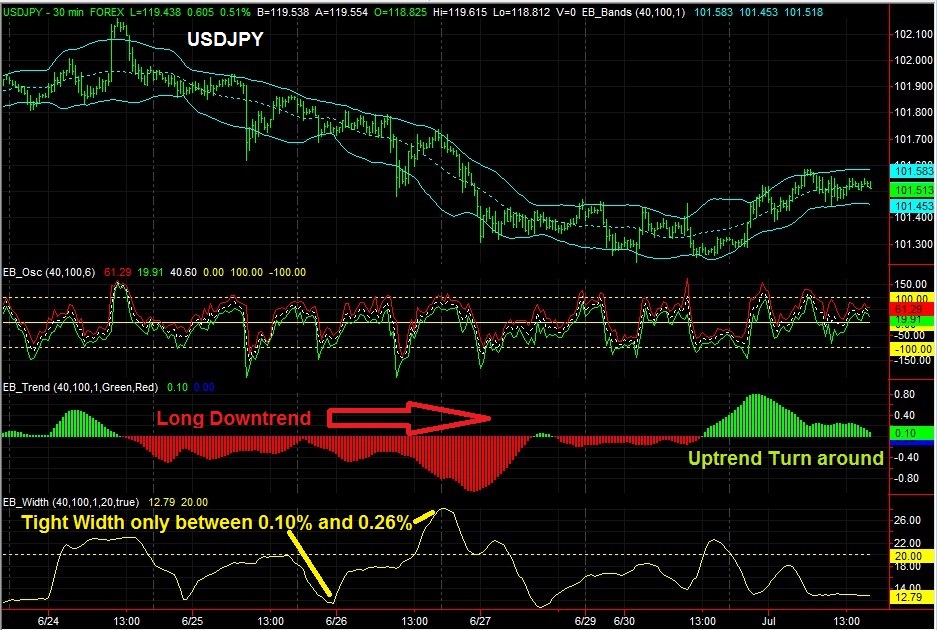
| USDJPY FOREX 30Minute Intraday Sample (EB3) |
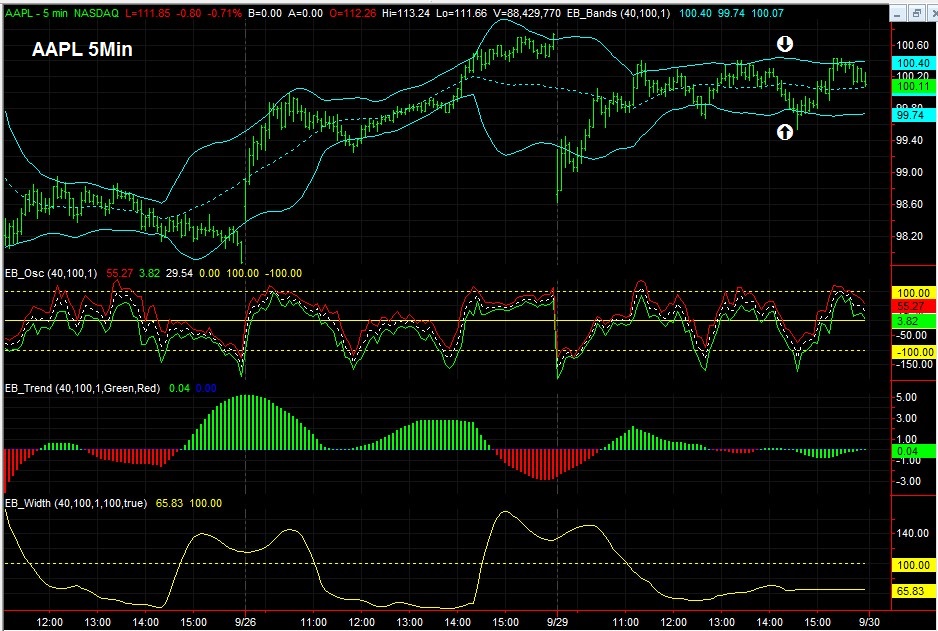
| AAPL Stock 5Minute Intraday Sample Chart (EB4) |
| Comparison EB to Bollinger |
| All these workspaces are available in: C:\Database\PSS_EB\*.tsw |
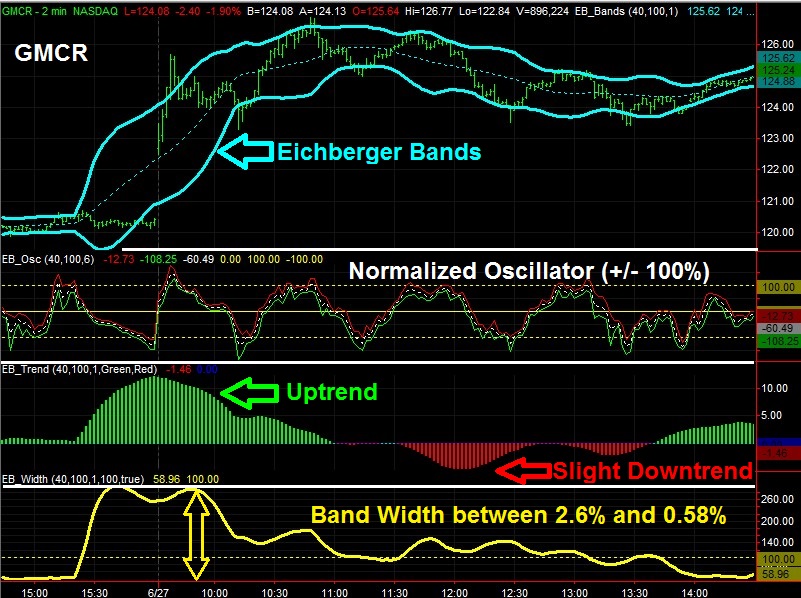
GMCR Stock 2Minute Intraday Sample Chart
(EB1)
Loads 2,000 bars from June 27, 2014:
Parameter: Lookback=40, Width=100%:
SPY Stock Daily Sample Chart
(EB2)
Loads 3 years from June 30,
2014:
Parameter: Lookback=40, Width=100%:
Crude Oil (CL)
Futures 1M inute Intraday Sample (EB5)
Loads 2 days from Dec 12th,2014:
Parameter: Lookback=40, Width=100% - TradeStation(EB5.tsw)
USDJPY FOREX 30Minute Intraday Sample
(EB3)
Loads one month from June 30, 2014:
Parameter: Lookback=40, Width=100%:
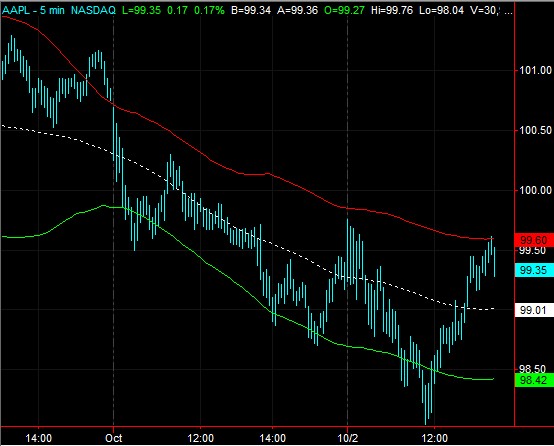
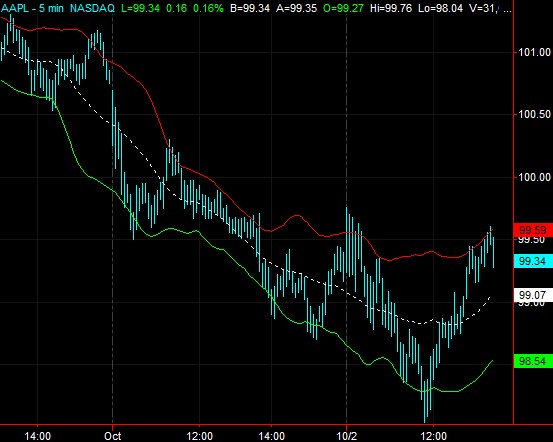
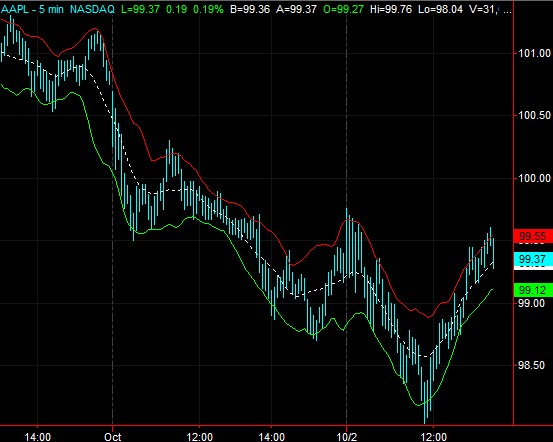
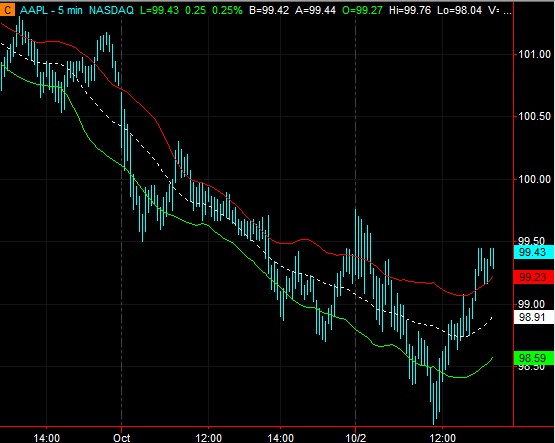
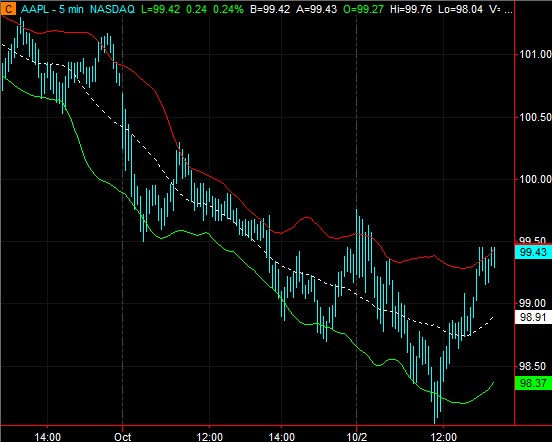
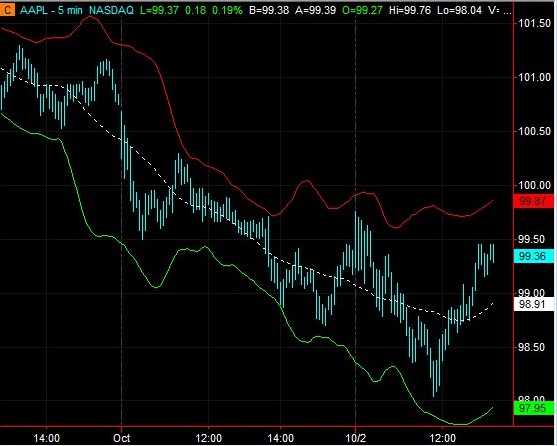
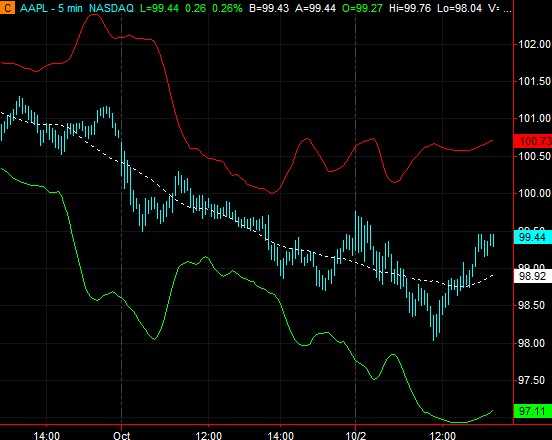
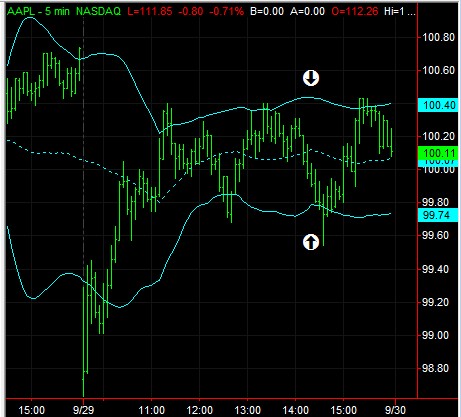
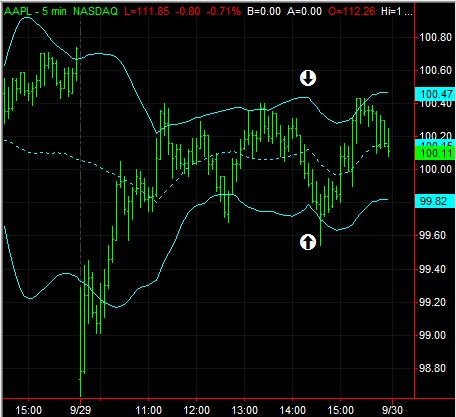
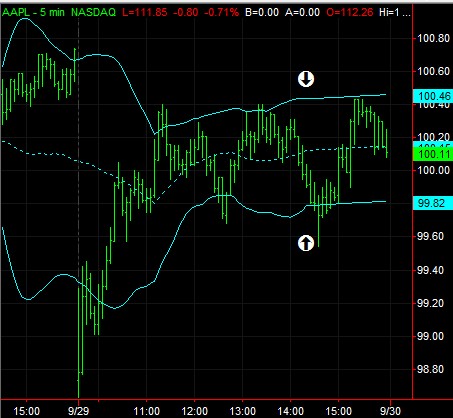
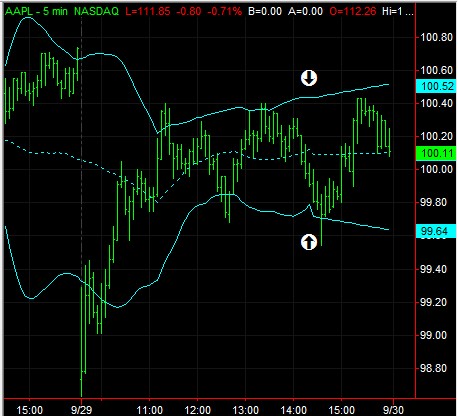
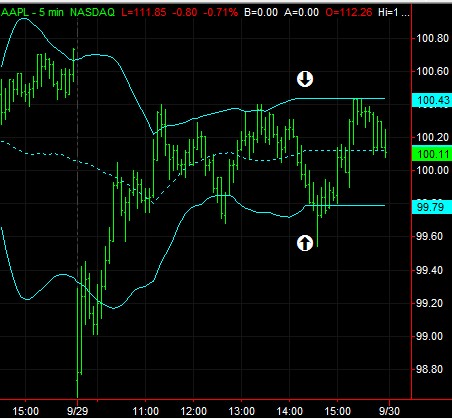
AAPL Stock 5 Minute Intraday Sample Chart
(EB4)
Loads 10 Days from Sep 29, 2014:
Parameter: Lookback=40, Width=100%:
Eichberger Band Indicators & Parameters:
| Eichberger Band Indicators: | ||||||||||||||
The following "Eichberger Bands"
Indicators are
available:
"Eichberger Bands" Indicators share the
same set of Parameters - see below - |
||||||||||||||
Eichberger Band Parameters:
|
||||||||||||||
| Lookback: Specifies the number bars to be used for the Eichberger Band Calculations (Default is 40 Bars):
|
||||||||||||||
| Band Width: Specifies the width (in percent) of the bands (Default is 100%) - Example below:
|
||||||||||||||
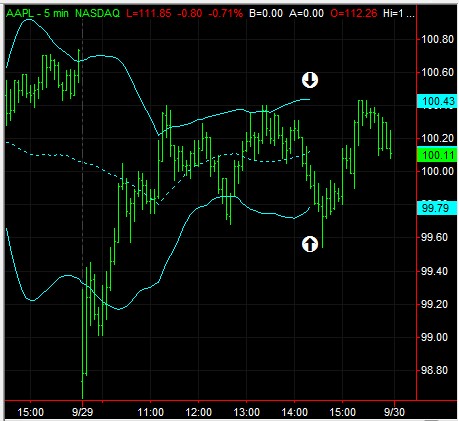
| Extension Type: Specifies how we extend from the last confirmed point - using Sample Workspace (EB4.tsw)
because the confirmed points ends before the last Bar (half the lookback). Example: With a lookback of 40 bars - the last 20 bars need to be extended. |
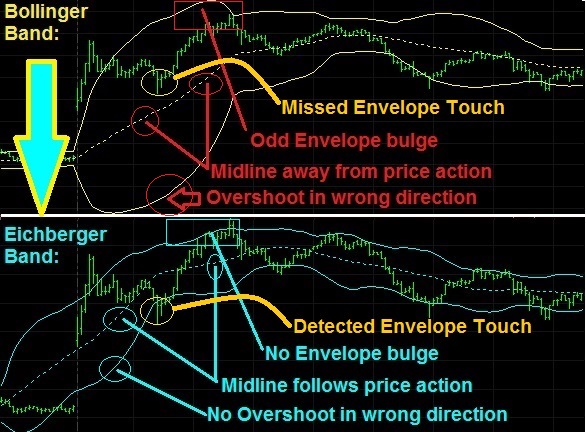
Eichberger Bands and Bollinger Bands:
The "Eichberger Bands" indicators
offer the following improvements to the widely used "Bollinger
Bands":
The following chart clarifies the
differences: |
|
These improvements allows the "Eichberger Bands"
Oscillator(EB_Osc) to give more significant signals: |
|
Other approaches to improve on the popular Bollinger Bands exit: Effectiveness - Wiki PDF Fixing Bollinger bands - Futures Magazine 2010 PDF Engineering Better Bollinger Bands INVIVOANALYTICS PDF |
|
Convert price noise into smooth tradable dance between
ups/downs! Example of a typical noisy Price Pattern: 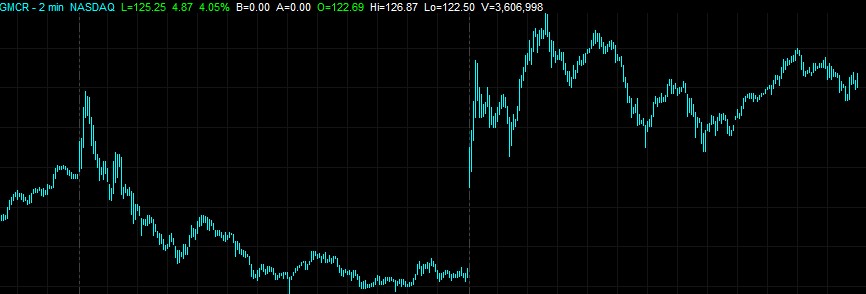
|
Step1: Create mathematical
"envelope" - red=Top, green=botton range: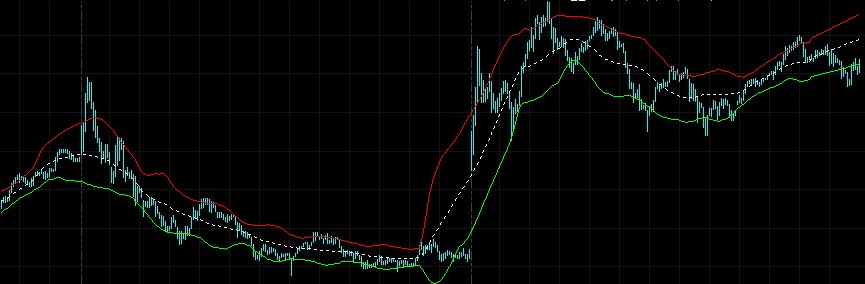 The "Eichberger Bands" model tracks the High an Lows independently and their angle etc. |
| This avoids the overshooting of the volatile Bollinger Bands
(yellow lines), because the "Eichberger Bands" does not use a simple moving average for the anchoring center Bollinger line, around with the deviation width is simply added/substracted. 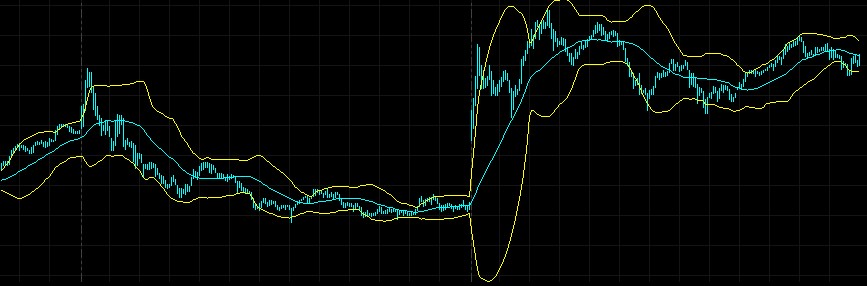 |
Step2: Normalize the price against the smooth
ranges: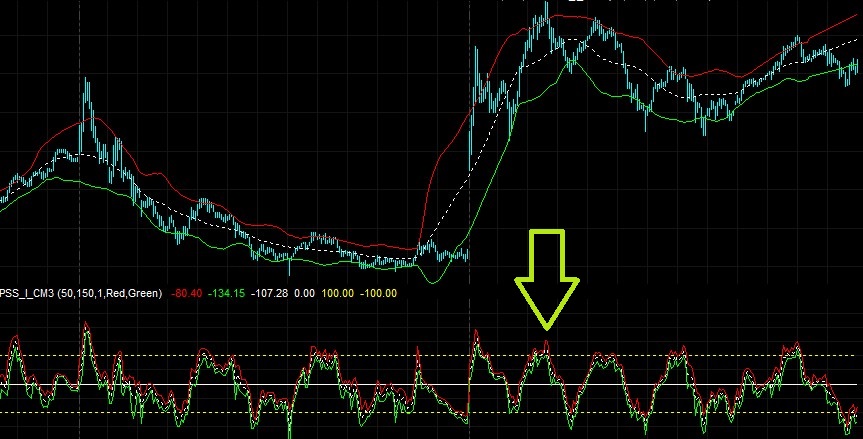
(Example GMCR 2Min Jun 27, 2014) |
Eichberger Bands Code available:
The EasyLanguage Code for the Eichberger Bands is available, so you can customize and also add EB to your strategies.
| EB_Bands | view the Bands with the price - to identify key price levels etc. |
| EB_Osc | view oscillating patterns, rhythms and their frequencies for timing |
| EB_Trend | Identify the trend early and the trend strength |
| EB_Width | view current actual trading range (as percent or the actual price value) |
We have more than 25 years experience developing software for Stock and Futures
Trading,
and developed business and database software systems for more than 30
years (see products below)
We are offering excellent
Personalized Services
for TradeStation� to assist you in:
- creating your
own
trading custom strategies and/or chart indicators and RadarScreen� setups
- creating any advanced user functions and DLL programming
- personalized remote access interactive, training and programming sessions
or on-site training
- phone consulting
Our rate is only $100 per hour for programming and telephone
consulting.
|
Professionel Software Solutions Products: The following powerful utilities are available: |
| Trading
Simulator (PssTrdSim) Allows you to replay/trade and test your interactive trading skills (any market and timeframe) |
| Eichberger Bands
(PssEichB) Eichberger Bands - the improved Bollinger Bands without the lag and overshoots |
| Diamond
Backtesting
and Walk Forward Manager (BTWFMgr) State of the art powerful "Swiss army knife" when it comes to optimizing and analyzing your trading strategies -also with walk forward backtesting |
| Universal Trend Detection System
(UNITRDES) "Never miss a trend again" - detects and displays the trend in any timeframe and market! |
|
Trading Performance
Analyzer (TrdPerfAna) Details analysis and optimization of your live or back tested TradeStation� Strategy Results Check out the Overview sample here |
| We are now also featured on Softpedia PDF |
We also developed the following powerful Indicators:
RISK DISCLOSURE:
Futures and forex trading contains substantial risk and is not for every investor.
An investor could potentially lose all or more than the initial investment.
Risk capital is money that can be lost without jeopardizing one's financial security or life style.
Only risk capital should be used for trading and only those with sufficient risk capital should consider trading.
Past performance is not necessarily indicative of future results.
HYPOTHETICAL PERFORMANCE DISCLAIMER:
Hypothetical performance results have many inherent limitations, some of which are described below.
No representation is being made that any account will or is likely to achieve profits or losses similar to those shown;
in fact, there are frequently sharp differences between hypothetical performance results and
the actual results subsequently achieved by any particular trading program.
One of the limitations of hypothetical performance results is that they are generally prepared with the benefit of hindsight.
In addition, hypothetical trading does not involve financial risk, and no hypothetical trading record
can completely account for the impact of financial risk of actual trading.
For example, the ability to withstand losses or to adhere to a particular trading program in spite of trading losses are
material points which can also adversely affect actual trading results. There are numerous other factors related to
the markets in general or to the implementation of any specific trading program which cannot be fully accounted for in the preparation
of hypothetical performance results and all which can adversely affect trading results.
ADDITIONAL DISCLAIMER:
Professional Software Solutions(PSS), also known as PSS assumes no responsibility for your trading results.
Past performance does not guarantee future performance and Professional Software Solutions does not make any performance representations or guarantees.
Any chart or trading demonstration produced by Professional Software Solutions representing trades and using any systems/methods on the www.ProfSoftware.com website
or in any advertisement, seminar, brochure, magazine or online demonstrations are to be considered hypothetical trades for educational purposes only.
No trading system can guarantee profits. Hypothetical trading results can be unreliable.
Testimonials Disclosure:
Testimonials appearing on this website may not be representative of other clients or customers and is not a guarantee of future performance or success.
© Copyright 2004-2018, Burkhard Eichberger, Professional Software Solutions - All Rights Reserved Worldwide.